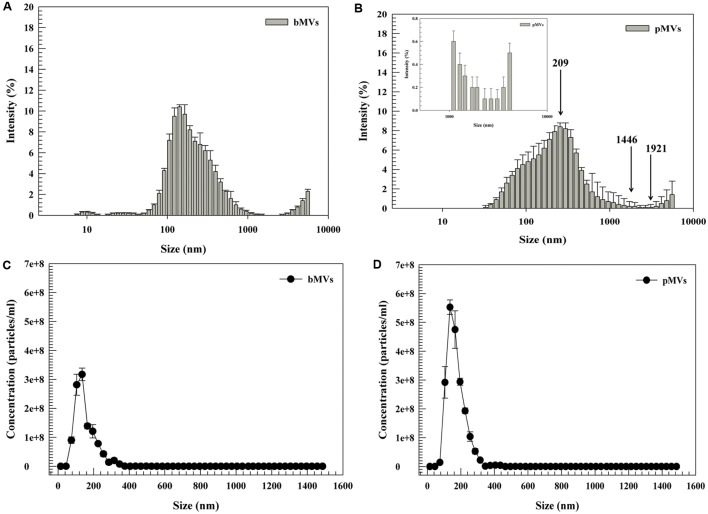
FIGURE 3.
Physicochemical characterization of L. reuteri DSM 17938 through DLS and Nanosight NS300 system (NTA). The DLS histogram analysis of bMVs and pMVs are shown in (A,B) respectively. bMVs and pMVs had a bimodal distribution of nanovesicles. The nanoparticle tracking distribution of bMVs and pMVs is shown in (C,D). Figures are representative of ten independent replicates for both DLS and NTA analysis. The size distribution represents the wide distribution of vesicles. The size distribution was calculated as intensity (%) using the multimodal distribution of software (Malvern Instruments Ltd.). Arrows show the mean peaks of particles at 209 nm (Peak 1), 1446 nm (Peak 2), and 1921 nm (Peak 3) as herein reported in Sub-section “Physicochemical Characterization of pMVs and bMVs by DLS” of Section “Results.” The error bars represent the standard deviation.

