Figure 1.

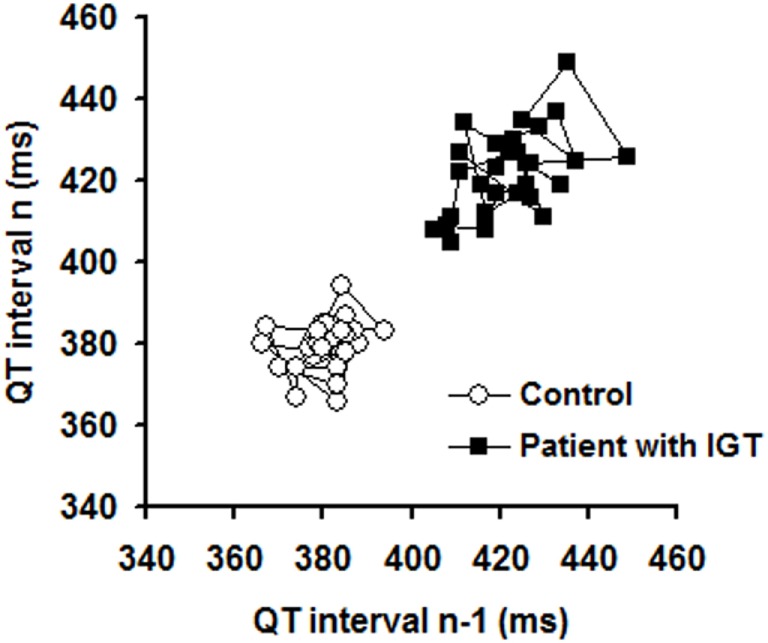
Representative Poincaré plots illustrating short-term temporal variability of the QT interval in a control individual and in a patient with impaired glucose tolerance (IGT).

Representative Poincaré plots illustrating short-term temporal variability of the QT interval in a control individual and in a patient with impaired glucose tolerance (IGT).