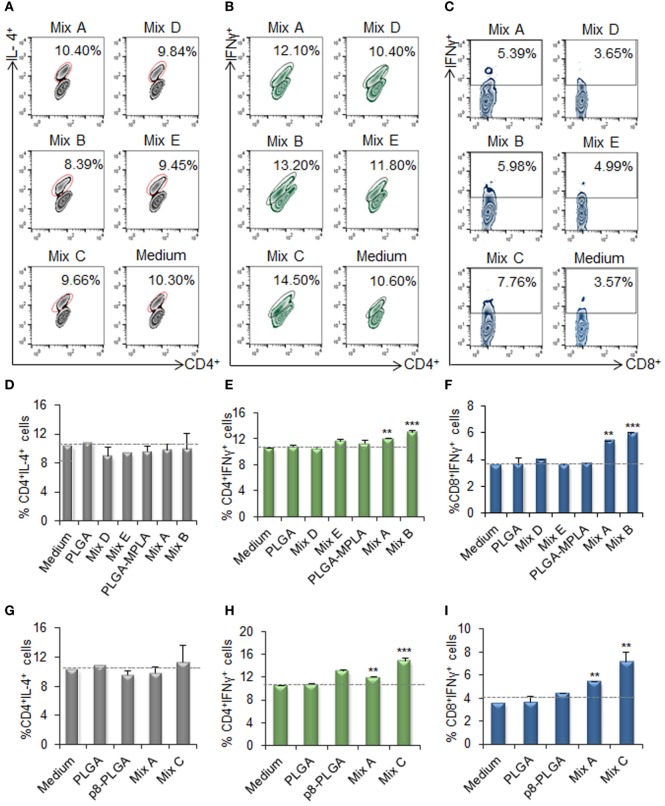
Figure 7.
IFNγ-producing CD4+ and CD8+ T cells among the spleen cell populations primed by dendritic cells (DCs) stimulated with the mix B or C. Spleen cells from naïve BALB/c mice were primed in vitro by DCs stimulated for 24 h with the different mixes of differentially functionalized nanoformulations (mix A, mix B, and mix C), the mix of soluble chimeric peptides (mix D), and the mix of soluble chimeric peptides plus monophosphoryl lipid A (MPLA) (mix E). Then, spleen cells were stained and analyzed by flow cytometry. The representative contour plots depict IL-4-producing CD4+ T cells (A), and IFNγ-producing CD4+ (B), and CD8+ (C) T cells. Diagram showing the percentage of (D,G) IL-4-producing CD4+ T cells, (E,H) IFNγ-producing CD4+, and (F,I) IFNγ-producing CD8+ T cells. Results are expressed as the mean ± SD and significant differences between T cells activated by DCs stimulated with mix A, mix B or mix C and T cells activated by unstimulated DCs are indicated by **p < 0.01, or ***p < 0.001.

