Figure 8.
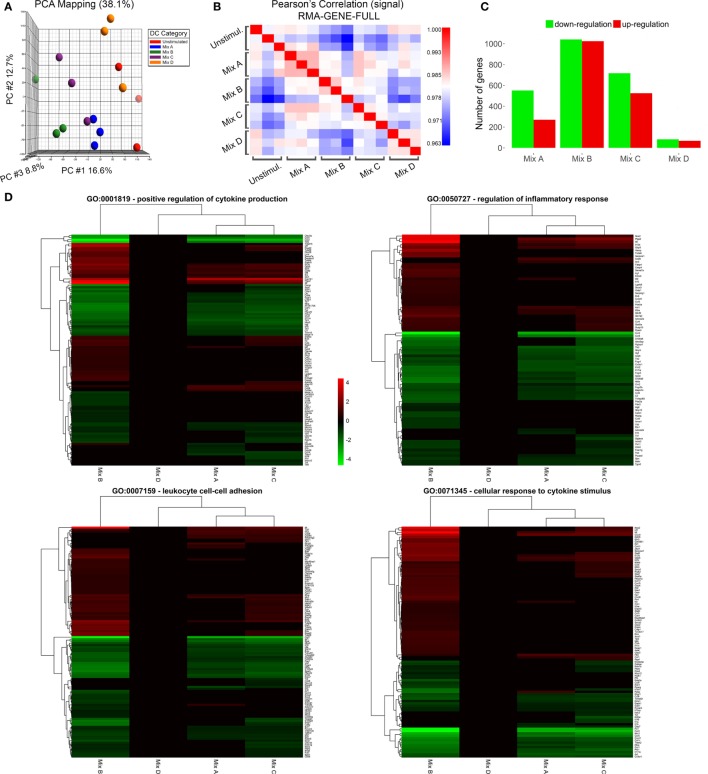
Microarray sample quality control and differential expression analysis. (A) Principal component analysis clustering of microarray samples and (B) sample-sample correlation heat map depicting relationship between replicates and/or samples. (C) Barplot of differentially up- and downregulated genes of dendritic cells (DCs) stimulated with the mix of poly(lactic-co-glycolic) acid (PLGA)-chCPAp, PLGA-chH1p, and PLGA-KMP-11p nanoformulations (mix A), the mix of PLGA-chCPAp-monophosphoryl lipid A (MPLA), PLGA-chH1p-MPLA, and PLGA-KMP-11p-MPLA nanoformulations (mix B), the mix of p8-PLGA-chCPAp, p8-PLGA-chH1p, and p8-PLGA-KMP-11p nanoformulations (mix C), or the mix of soluble chimeric peptides (mix D) vs. unstimulated DCs. (D) Heatmap representations of differentially expressed genes included in GO terms GO:0001819—positive regulation of cytokine production, GO:0050727—regulation of inflammatory response, GO:0007159—leukocyte cell–cell adhesion and GO:0071345—cellular response to cytokine stimulus. Instances with −0.585 < log2(fold change) < 0.585 and/or p-value >0.05 significance threshold are not colored. A p-value threshold of 0.05 and a log2 (fold change) threshold of ±0.585 (at least1.5-fold change) was used to determine differentially expressed genes of samples Mix A–D vs. unstimulated DCs.

