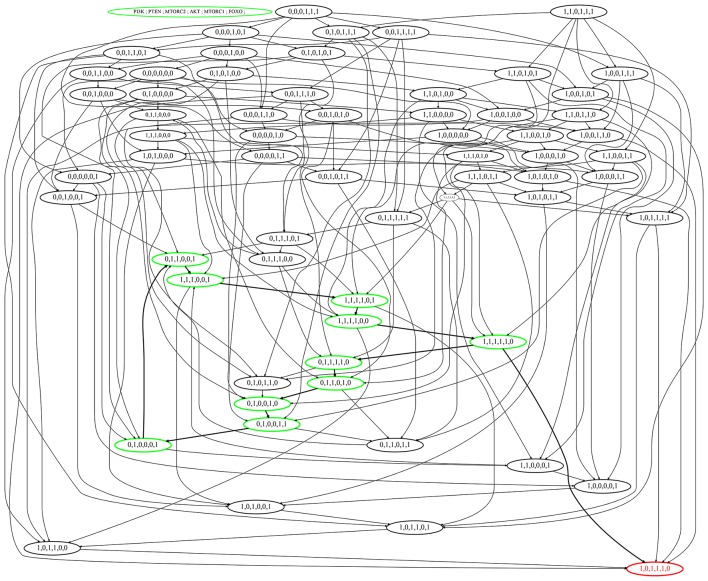
Figure 6.
State graph of the mTOR-associated BRN. Nodes of the state graph represent the states of the BRN and edges between states represent the evolution of states. A state in this graph shows the expressions of the entities PI3K, PTEN, mTORC2, Akt, mTORC1, and FOXO respectively. The stable steady state (1,0,1,1,1,0) represents high expression levels of all entities except tumor suppressors. Cycle having maximum betweenness centrality is represented in green color with bold arrows, also showing bifurcation toward stable state (1,0,1,1,1,0).

