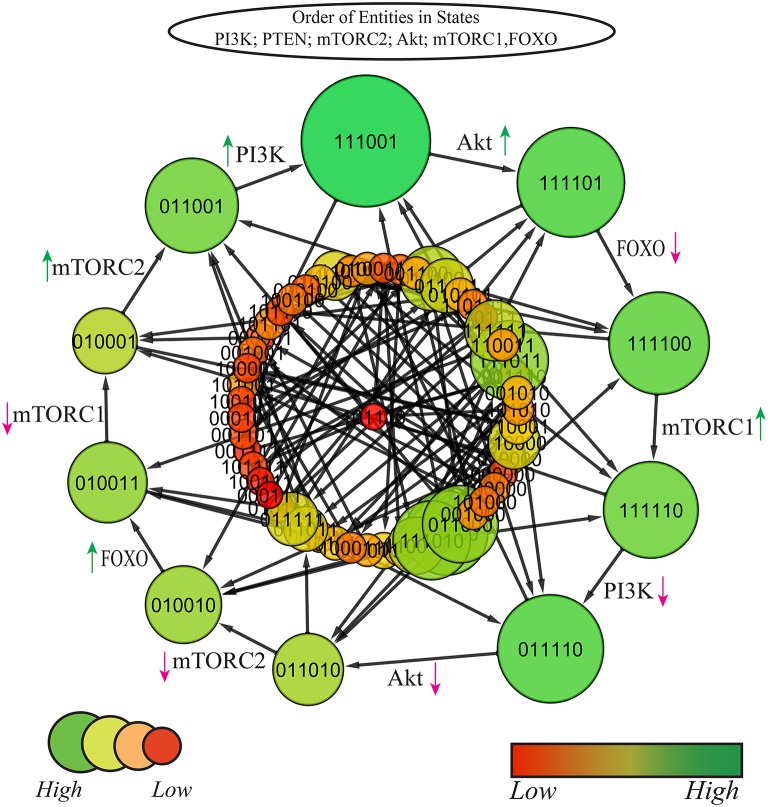
Figure 7.
State graph of mTOR associated BRN: size and color of nodes are scaled on the basis of betweenness centrality, larger nodes represent higher centralities with variable shades of green color (darker the color, higher is the centrality). The graph comprises of 64 states and 192 edges. Cycle with maximum betweenness centrality is extracted out at top layer. Red and green arrows represent degradation and production of entities, respectively.

