
FIGURE 7.
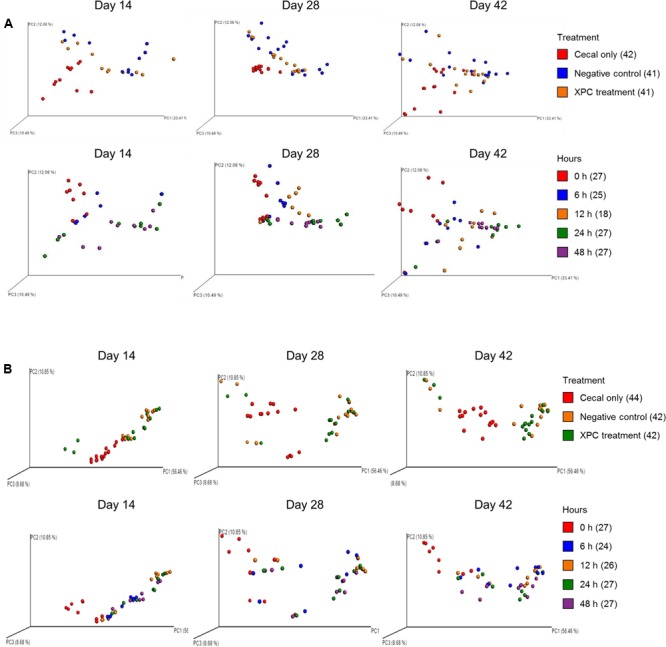
UniFrac weighted PCoA plots of (A) Trial 1 and (B) Trial 2. For label on treatment, cecal only (red), negative control (blue) and XPC (orange). For label on hour, 0 h (red), 6 h (blue), 12 h (orange), 24 h (green), and 48 h (purple).
Official websites use .gov
A
.gov website belongs to an official
government organization in the United States.
Secure .gov websites use HTTPS
A lock (
) or https:// means you've safely
connected to the .gov website. Share sensitive
information only on official, secure websites.
UniFrac weighted PCoA plots of (A) Trial 1 and (B) Trial 2. For label on treatment, cecal only (red), negative control (blue) and XPC (orange). For label on hour, 0 h (red), 6 h (blue), 12 h (orange), 24 h (green), and 48 h (purple).