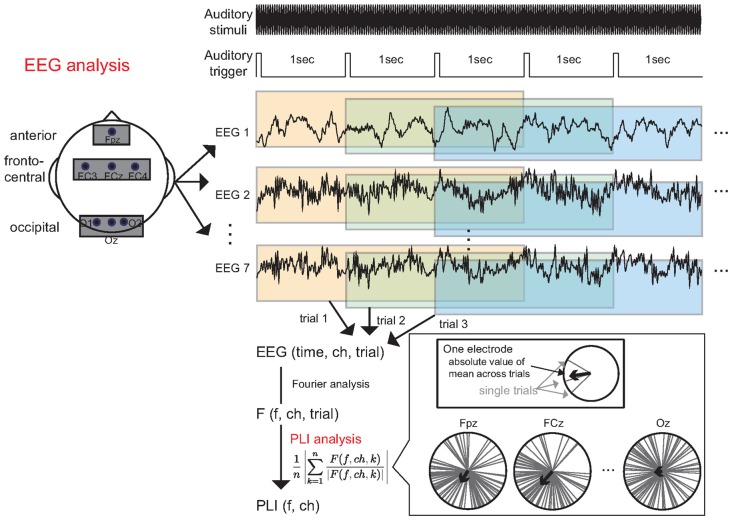
Figure 3.
Data analysis. The continuous EEG data were divided into 3000 ms epochs based on triggers that occurred every second. Subsequently, each epoch was subjected to Fourier analysis to calculate the frequency response. Finally, we calculated the 40 Hz phase-locking index (PLI) from the frequency response.

