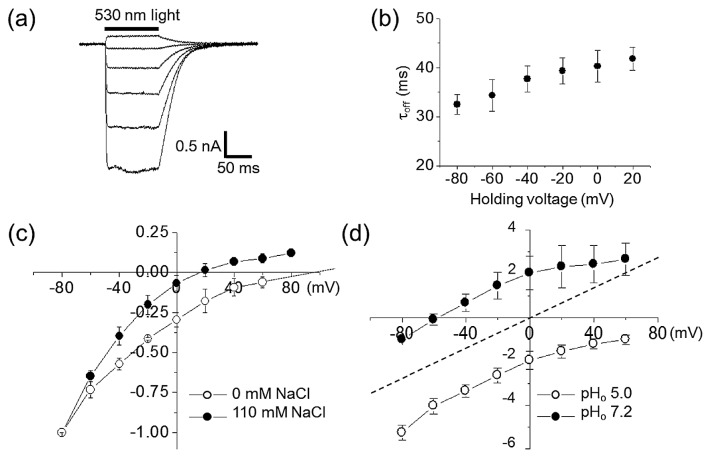
Figure 1.
Ion transport activity of GtCCR4 on ND7/23 cells recorded by a whole-cell patch clamp. (a) Representative photocurrents recorded at membrane potentials from −60 mV to +40 mV in 20 mV steps in standard solutions (See materials and methods). (b) Channel closing kinetics estimated by decay of photocurrents in standard solutions (N=8). Data represent the mean±SE. (c) I–V curves of stationary photocurrents with 110 mM (solid circle) or 0 mM (open circle) intercellular NaCl concentrations. The solution contained 110 mM NaCl, 2 mM CaCl2, 2 mM MgCl2, 5 mM KCl 10 mM EGTA-NaOH and 10 mM Hepes-NaOH (pH 7.2). A solution without Na+ contained 110 mM NMG-Cl, 2 mM CaCl2, 2 mM MgCl2, 5 mM KCl 10 mM EGTA-NMG and 10 mM Hepes-NMG (pH 7.2). Extracellular solution contained 140 mM NaCl, 2 mM CaCl2, 2 mM MgCl2, 2 mM KCl and Hepes-NaOH (pH 7.2). The photocurrent amplitudes were normalized at −80 mV as −1.0. Data represent the mean±SE. (d) I–V curves of stationary photocurrents with extracellular pH 5.0 (open circle) or pH 7.2 (solid circle) in the absence of NaCl. Extracellular solution contained 140 mM NMG-Cl, 2 mM CaCl2, 2 mM MgCl2 and Hepes-NMG (pH 7.2) or citric acid (pH 5.0). Intercellular solution contained 110 mM NMG-Cl, 2 mM CaCl2, 2 mM MgCl2, 5 mM KCl 10 mM EGTA-NMG and 10 mM Hepes-NMG (pH 7.2). The x- and y-axis represent the membrane potential (mV) and normalized current, respectively. The currents were first measured at pHo 7.2 (solid circle), followed by change in solution to pH 5.0 (open circle) (N=3). The photocurrent amplitudes were normalized at −80 mV at pHo 7.2 (solid circle) as −1.0. The dashed line was the theoretical curve.

