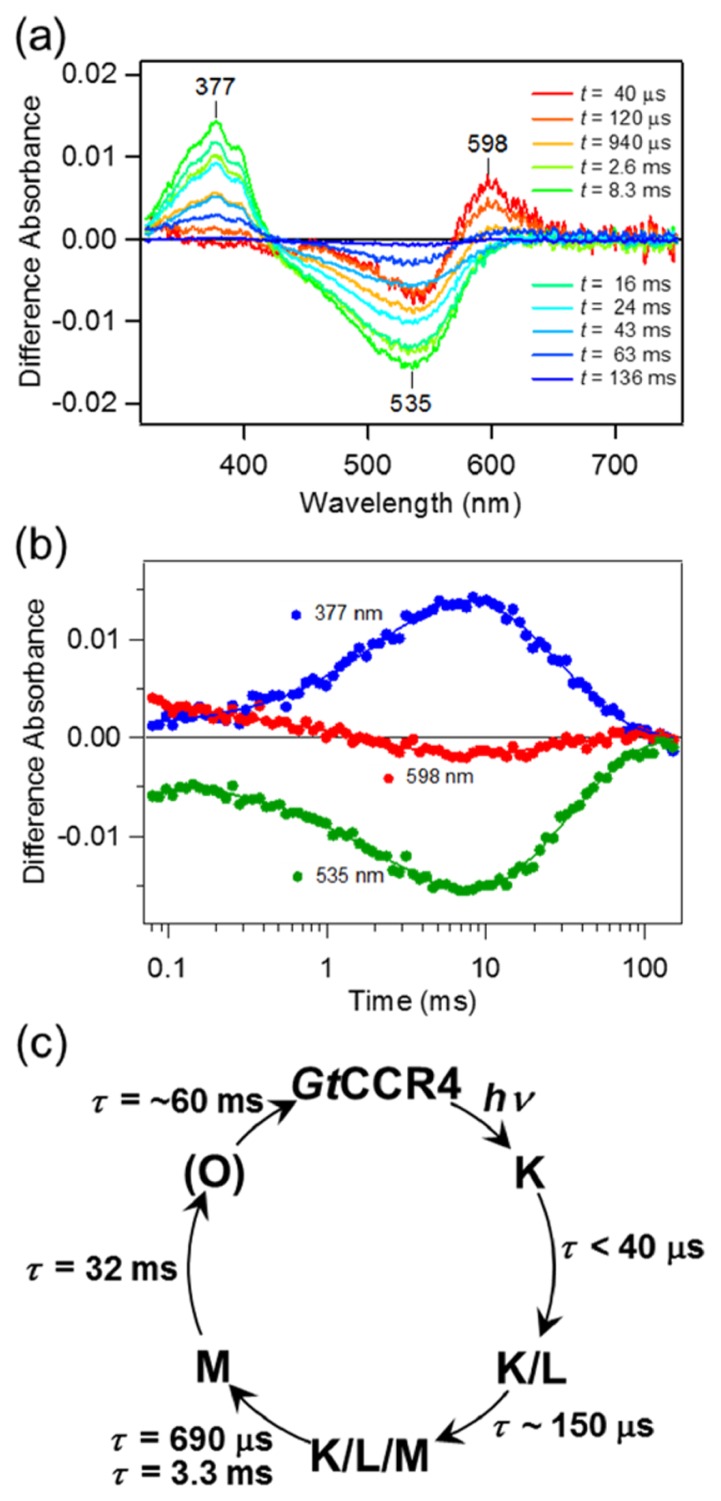
Figure 3.
Photocycle of GtCCR4. (a) Transient absorption spectra of GtCCR4. (b) Time traces of absorption changes of GtCCR4 at 377 (blue), 535 (green) and 598 (red) nm probe wavelengths. Solid lines indicate the fitted lines based on the sequential kinetic model shown in c. (c) Photocycle scheme of GtCCR4 determined by flash photolysis measurement.

