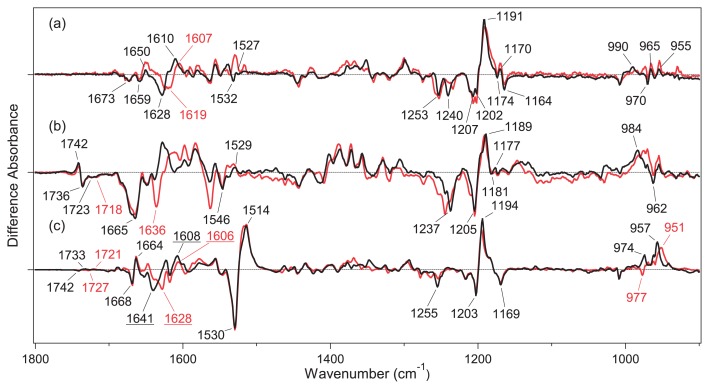
Figure 4.
Difference FTIR spectra of GtCCR4 (a), C1C2 (b) and BR (c) between the K intermediate and the unphotolyzed state in the 1800–900 cm−1 region measured at 77 K. The sample films were hydrated with H2O (black) and D2O (red). One division of the y-axis corresponds to 0.002 absorbance units. The black spectrum in (a) was multiplied by 2.6. The spectra in (b) and (c) were multiplied by 0.95 and 0.081, respectively. The data in (b) and (c) are reproduced from Ito et al. [30] and Kandori et al. [42].

