
Fig. 1. Representative flow cytometry of CD3+ T cells and CD14+ cells in the ovary.
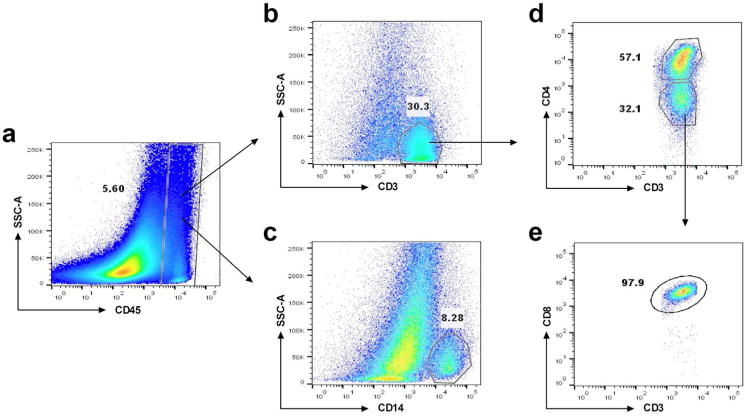
Dot plots showing the gating strategy to select cell populations. (a) CD45+ cells; (b) CD3+ cells; (c) CD14+ T cells; (d) CD3+CD4+ and CD3+CD4− T cells; (e) CD3+CD8+ T cells.