
Fig. 2. Yield of CD45+ cells from the ovary.
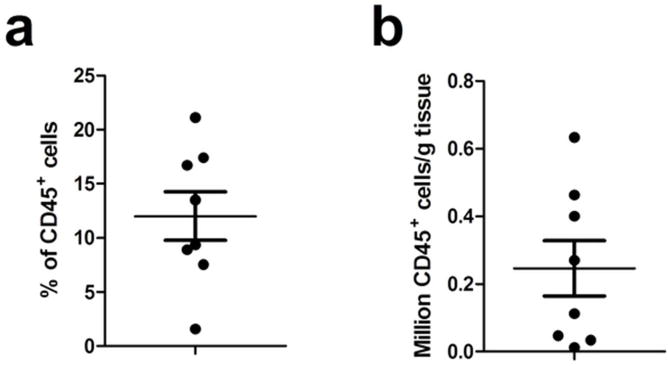
Flow cytometric analysis of CD45+ cells in mixed cells suspension from ovarian tissue (n=8). Data are expressed as (a) % CD45+ cells in the mixed cell population and (b) CD45+ cells per g of tissue. Each dot represents a single patient. Horizontal lines represent the mean ± SEM. Average weight of tissue received was 1.6±1.0g.