
Fig. 3. Distribution of CD3+ T cells and CD14+ cells in the ovary.
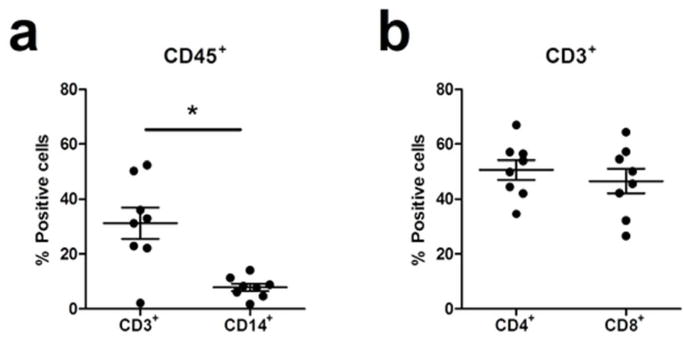
(a) Flow cytometric analysis of the percentage of CD3+ or CD14+ cells after gating on CD45+ cells and (b) CD4+ or CD8+ T cells after gating on CD3+ cells in ovarian tissues (n=8). Each dot represents a single patient. Horizontal lines represent the mean ± SEM. *, p<0.05.