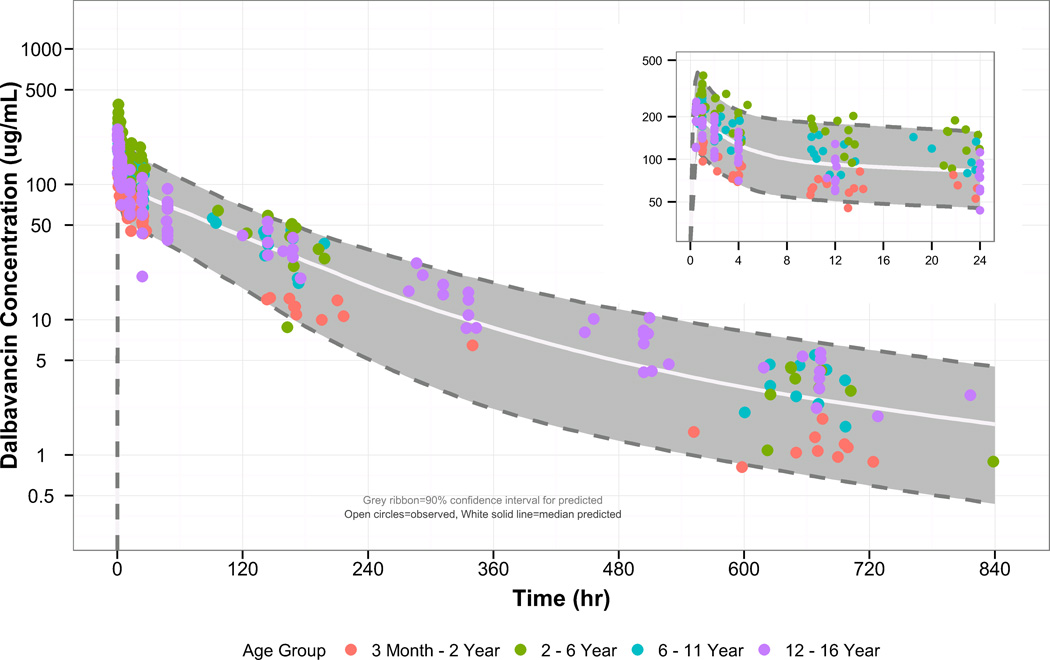
Figure 3.
Visual comparison of the observed and simulated dalbavancin concentrations in pediatric subjects, stratified by post-natal age. The grey region denotes the 90% confidence interval for the predictions, the circles denote the observed concentrations, and the white solid line is the median for the predictions. The inset graph is a visual comparison of the data using a smaller time scale (0 – 24 hours after first dose).

