Figure.
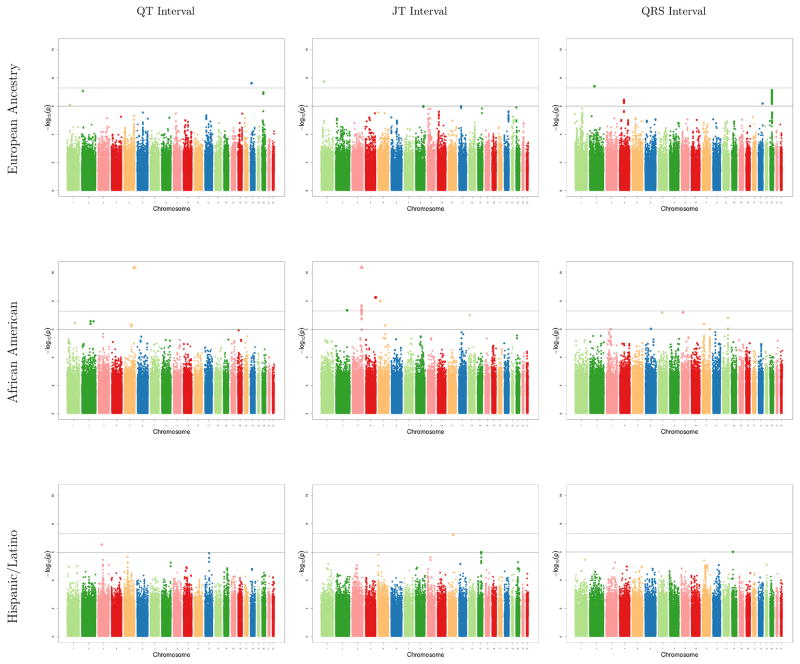
Manhattan plots from each ancestry specific meta-analysis (row) for sulfonylurea-SNP interaction associations with each ECG phenotype (column). The dashed line is the genome-wide threshold for significance (P < 5 x 10⁻⁸). The solid line is the threshold for suggestive associations (P < 10−6). SNPs with P values < 10−10, outside of the range of the Y axis, are denoted by triangles.

