Figure 2.

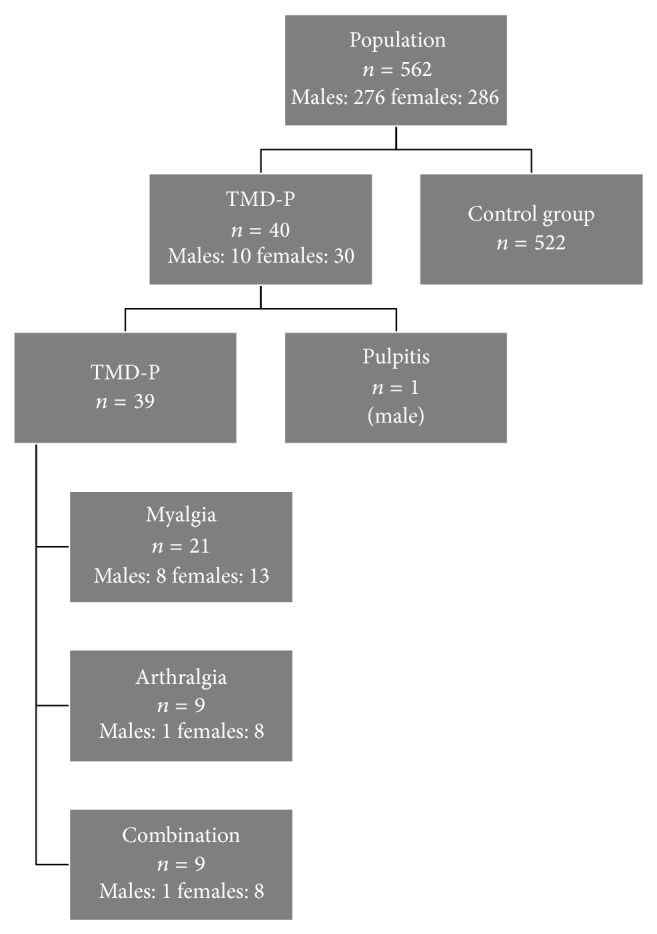
Flowchart showing the number of patients answering the TMD-P questions. The left column shows the case group with the distribution by sex. The right column shows the size of the control group.

Flowchart showing the number of patients answering the TMD-P questions. The left column shows the case group with the distribution by sex. The right column shows the size of the control group.