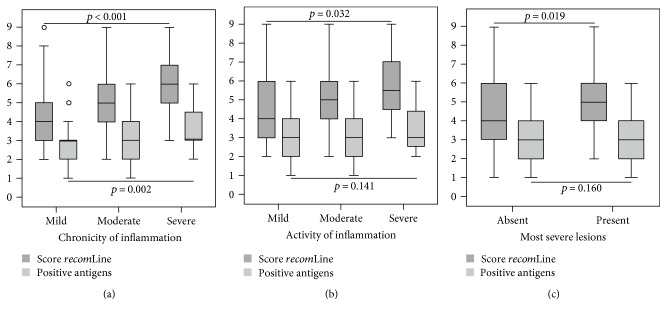
Figure 2.
Box plot diagrams showing the association between recomLine test results (dark grey: score recomLine/light grey: number of positive antigens) and histological findings in H. pylori positive cases. (a) Correlation between recomLine test results and the chronicity of inflammation (n = 391). (b) Correlation according to the activity of inflammation (n = 389) as well as (c) pathological findings (n = 95) according to histology. Data are presented as box plot showing the median, 75th and 25th percentile, outlier, and extreme values. Significances were calculated using the Kruskal-Wallis test. The results show a significant correlation between the achieved recomLine score and histological findings. The sum of positive antigens only correlates significantly with the chronicity of inflammation.

