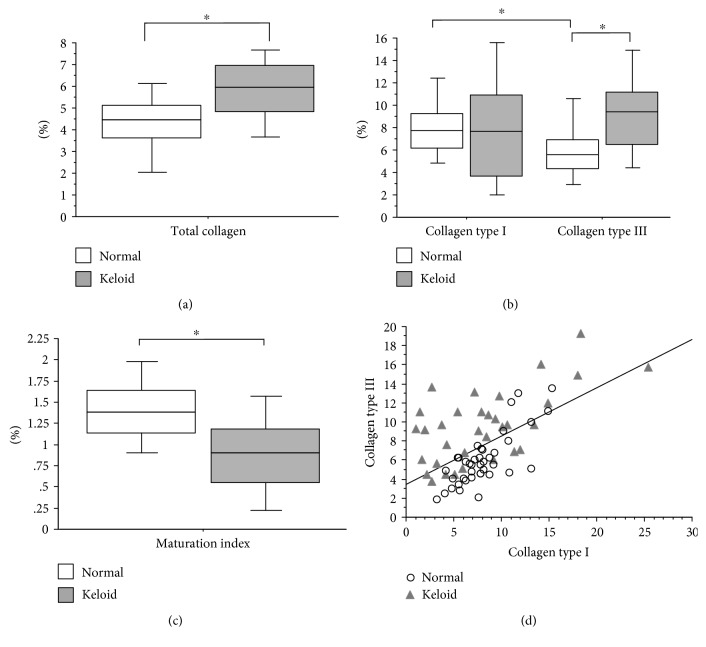
Figure 2.
(a) Total collagen percentage present in biopsies of patients with keloid compared with that of patients in the control group (Mann–Whitney; p < 0.0001). (b) Percentage of collagens types I and III present in biopsies of patients with keloid compared with that of patients in the control group. Analysis of collagen type I in patients with keloid compared with that in patients in the control group (Mann–Whitney; p = 0.653). Analysis of collagen type III in patients with keloid compared with that in patients in the control group (Mann–Whitney; p = 0.0001). Analysis of collagen types I and III in the control group (Wilcoxon; p < 0.0001). Analysis of collagen types I and III in patients with keloid (Wilcoxon; p = 0.126). (c) Maturation index calculated from the percentages of collagen I by III present in biopsies of patients with keloid compared with that of the control group (Mann–Whitney; p < 0.0001). The horizontal line represents the median, the bar percentile of 25% to 75% and the vertical line percentile of 10 to 90. (d) Correlation between the percentage of collagens type I and type III in patients with keloid compared with patients in the control group (Spearman; p < 0.0001, z = 4.293). ∗ indicates significant p value.

