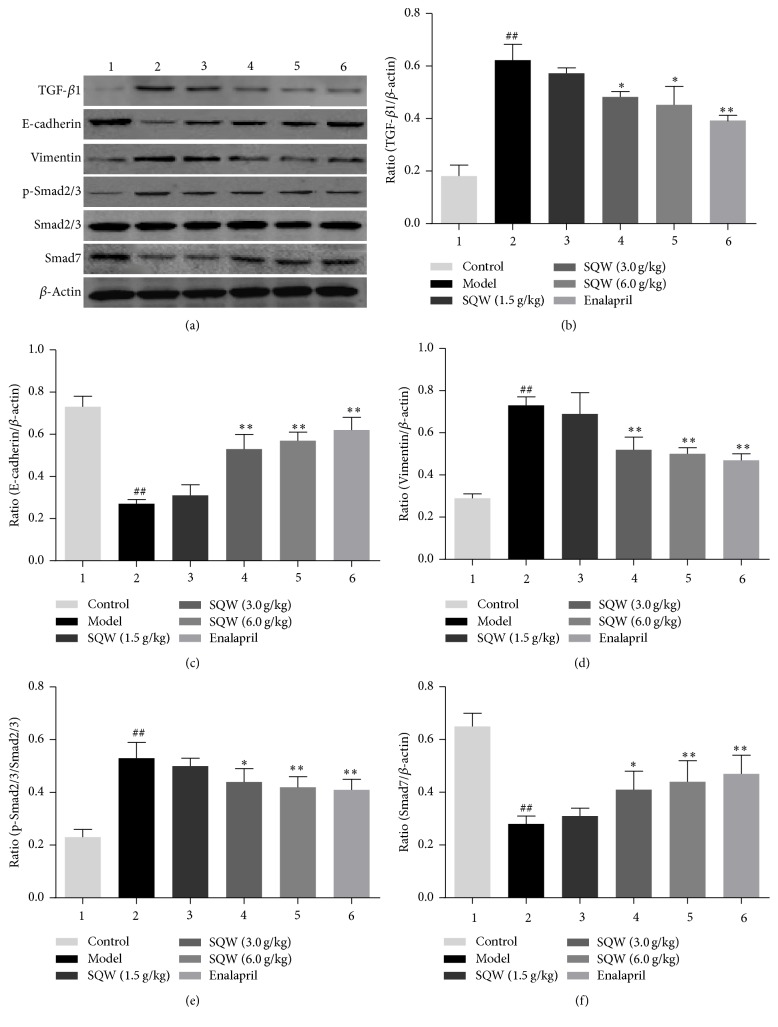
Figure 4.
Effect of SQW on expressions of TGF-β1, E-cadherin, Vimentin, p-Smad2/3, and Smad7 detected by Western blot in kidney samples. Semiquantitative data of the proteins were presented as relative ratio to β-actin. Semiquantitative data of p-Smad2/3 were presented as the relative ratio to Smad2/3. ##P < 0.01 compared with control group; ∗P < 0.05; ∗∗P < 0.01 compared with model group.

