Fig. 6.
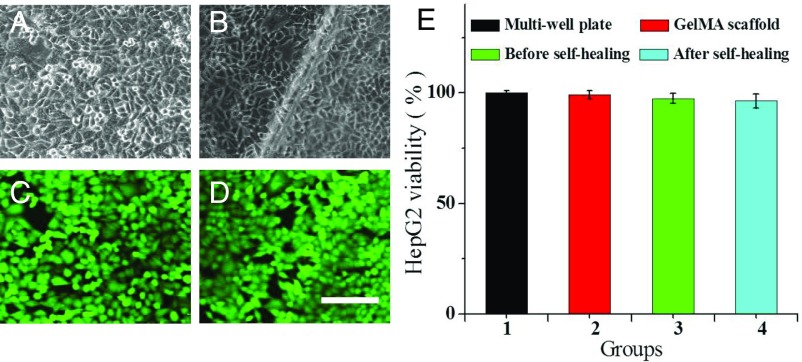
(A–D) CLSM images of the HepG2 cells cultured on hybrid hydrogels before (A and C) and after (B and D) self-healing. A and B are the bright-field microscopy images, and C and D are the calcein-AM fluorescent images. (Scale bar: 100 μm.) (E) Results of the HepG2 cell MTT assays cultured on different hydrogels for 24 h.

