Fig. 1.
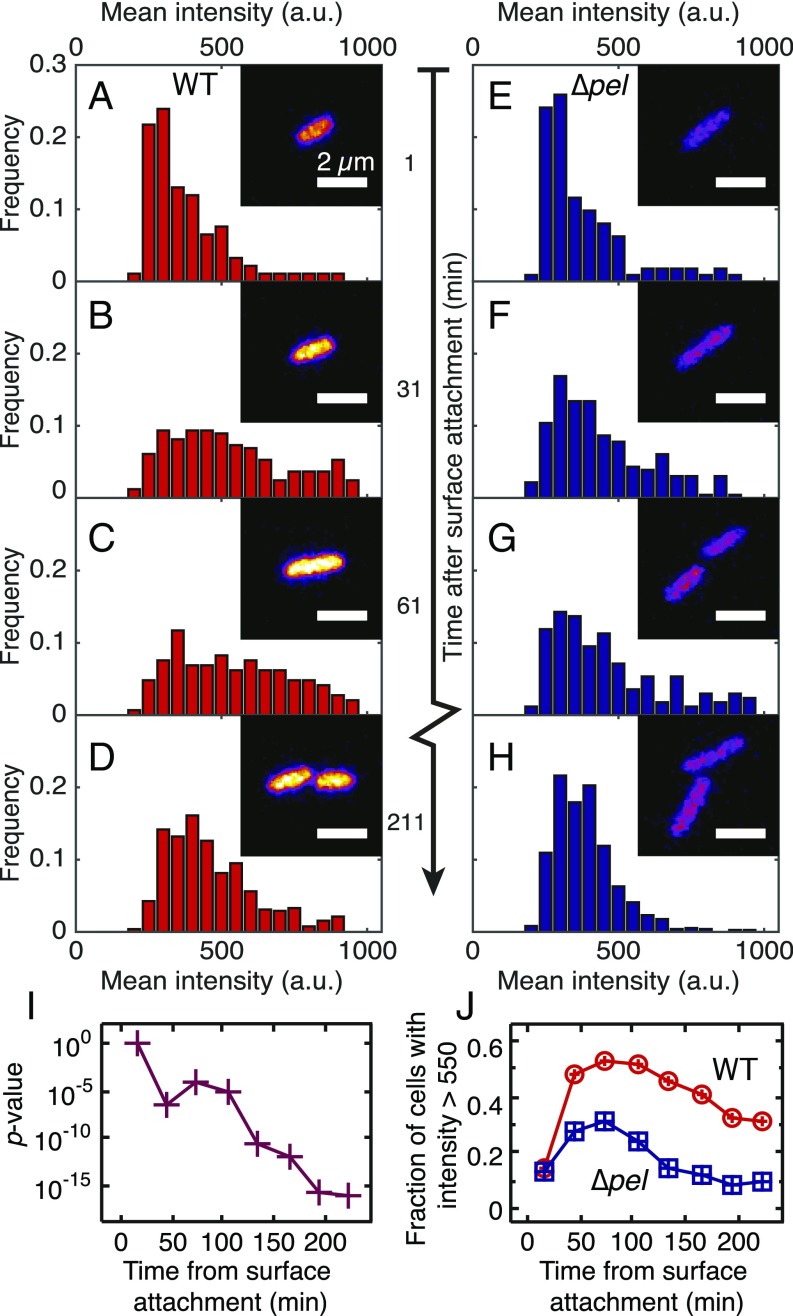
Histograms of average fluorescence intensity per cell for WT (A–D) and ∆pel (E–H) populations during 30-min intervals that begin at the times indicated. For each histogram, n ≥ 100 cells from at least five independent experiments. Less than 30 min after surface attachment, WT (A) and ∆pel (E) histograms are indistinguishable (two-sample Kolmogorov–Smirnov test, P = 0.87). After 30 min, both WT and ∆pel populations have broadened toward higher intensities, with the WT showing a larger change. (Insets) Sample confocal micrographs taken during each time window. This time series of micrographs tracks the brightness of one WT bacterium and one Δpel bacterium and their daughter cells. Purple, lower intensity; yellow, higher intensity. (I) P values from comparing WT and ∆pel populations using a two-sample Kolmogorov–Smirnov test. (J) The percentage of cells in each population that have a mean intensity brighter than 550 a.u.

