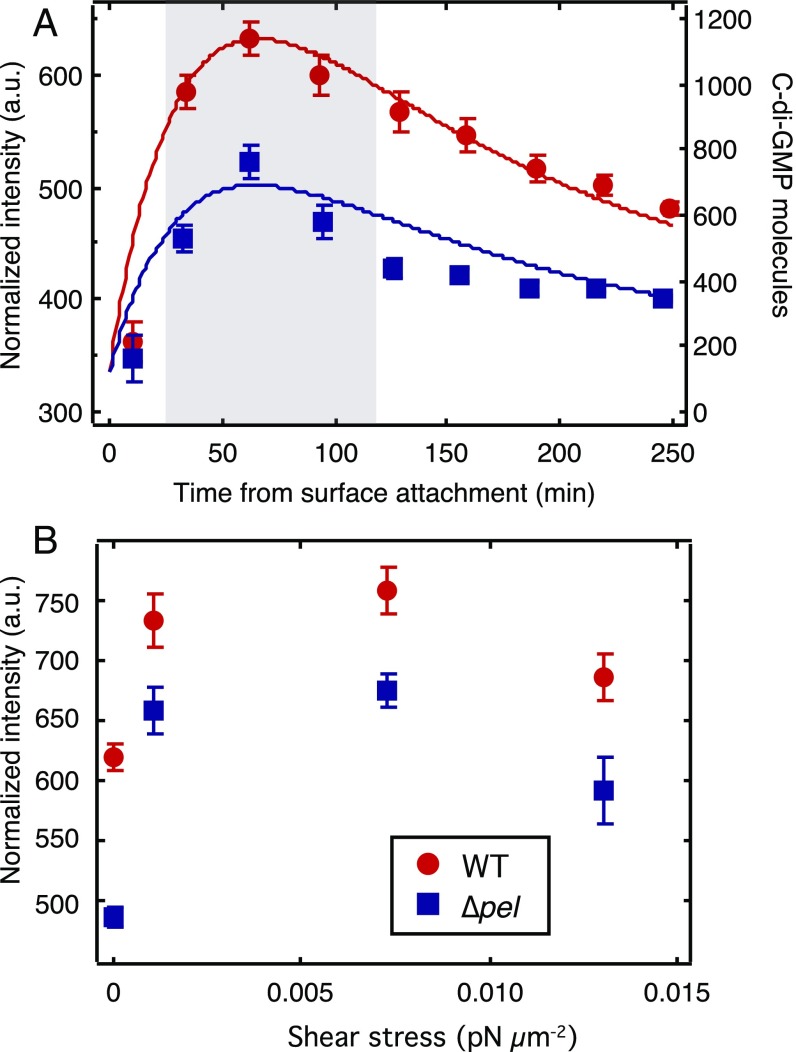
Fig. 2.
Pel production and mechanical shear both increase intracellular c-di-GMP levels. (A) Average intensity vs. time for the first 250 min after surface attachment. Both WT and ∆pel (data points, left axis) start at the same level, sharply increase during the first hour, and then decrease. Corresponding curves are from our model (solid lines, right axis). (B) Peak intensity vs. applied shear stress. Each data point is the average of all cells imaged in the interval 30–120 min after surface attachment, corresponding to the peaks in A (gray shaded region). n ≥ 100 cells, from at least two independent experiments. Error bars are SEM.

