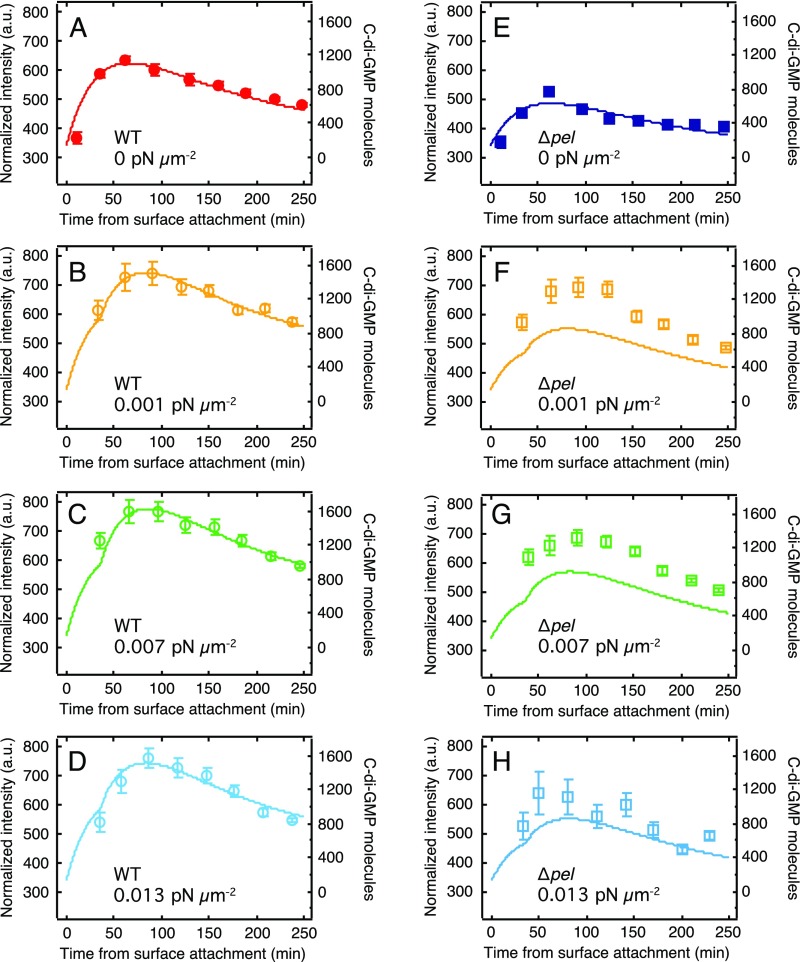
Fig. S7.
c-di-GMP levels increase in response to a range of magnitudes of external shear stress. Curves for WT (A–D) and ∆pel (E–H) knockout strains in response to varying amounts of external shear stress. Data points are experimental results (left axis), and solid curves are from our model (right axis). Model stress levels ( parameter) were fitted to the WT data and then applied to the ∆pel model.

