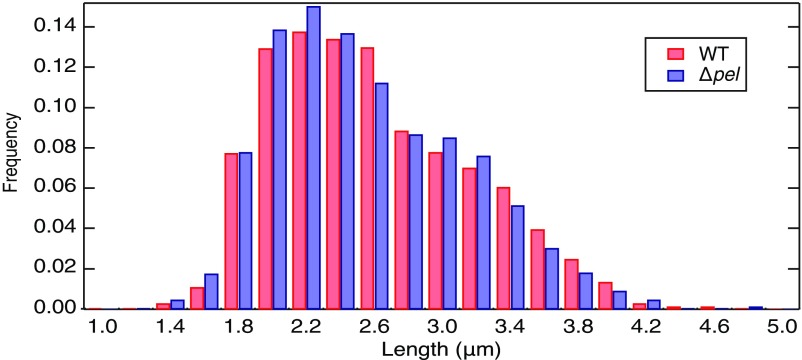
Fig. S9.
Image processing faithfully measures intensity data. Histograms of cell length for WT and ∆pel data. We measure both populations to have identical length distributions with our image-processing techniques. This ensures that brighter cells are not artificially measured to be longer by setting an intensity threshold.

