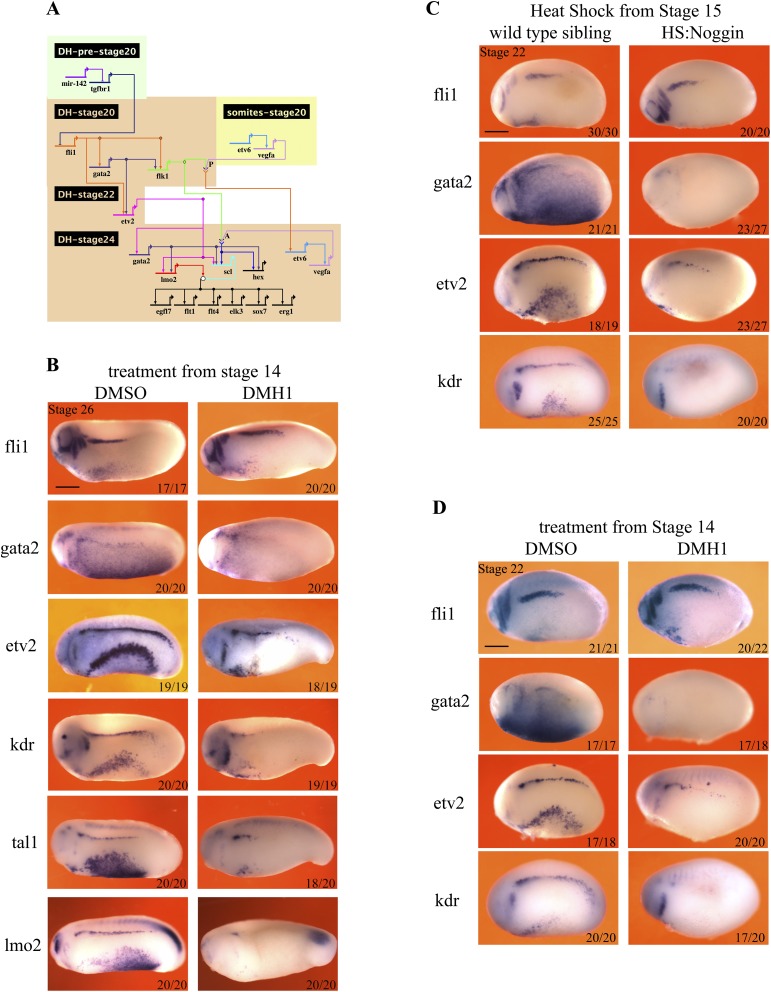
Fig. S4.
Bmp signaling is required for gata2 expression in the DLP. (A) GRN summarizing the known requirements for the programming of DH in the DLP. The timing and tissue of expression is shown by the position of the gene name with gene inputs shown as arrows. Note that arrows do not necessarily signify direct interactions but indicate requirements for expression. Where two gene products physically interact for the expression of a target, their arrows converge on chevrons for receptor ligand interaction or a circle for interactions between transcription factors. Where a gene is shown twice indicates a change in its regulation (gata2 is initiated by fli1 but later requires etv2 for its maintenance). (B) Hematopoietic programming in the DLP, at stage 26, following DMH1 treatment from stage 14. Embryos were treated with 100 μM DMH1 from stage 14 and were collected for analysis at stage 26. WISH was used to stain cells expressing genes that are essential for hematopoietic programming in the DLP: fli1, gata2, kdr, etv2, tal1, lmo2, and hex. Embryos are shown in lateral view, with anterior to the left and dorsal at the top. Red arrowheads mark staining in the DLP. (C) Hematopoietic programming in the DLP at stage 22, following heat shock-induced noggin expression at stage 14. The expression of fli1 in the DLP is unchanged, whereas etv2 is expressed at reduced levels and gata2 and kdr are absent (red arrowheads). Embryos were heat-shocked for 15 min at 35 °C at stage 14 and were collected for analysis at stage 22. WISH was used to stain cells expressing genes that are essential to hematopoietic programming in the DLP: fli1, gata2, kdr, and etv2. (D) Hematopoietic programming in the DLP at stage 22, following DMH1 treatment from stage 14. The expression of fli1 in the DLP is unchanged, whereas etv2 is expressed at reduced levels and gata2 and kdr are absent. Embryos were treated with 100 μM DMH1 from stage 14 and were collected for analysis at stage 22. WISH was used to stain cells expressing genes that are essential for hematopoietic programming in the DLP: fli1, gata2, kdr, and etv2. Embryos are shown in lateral view, with anterior to the left and dorsal at the top. Numbers on individual images show the proportion of embryos that the image represents (Bottom Right). Images and numbers are from one experiment and are representative of two biological replicates.

