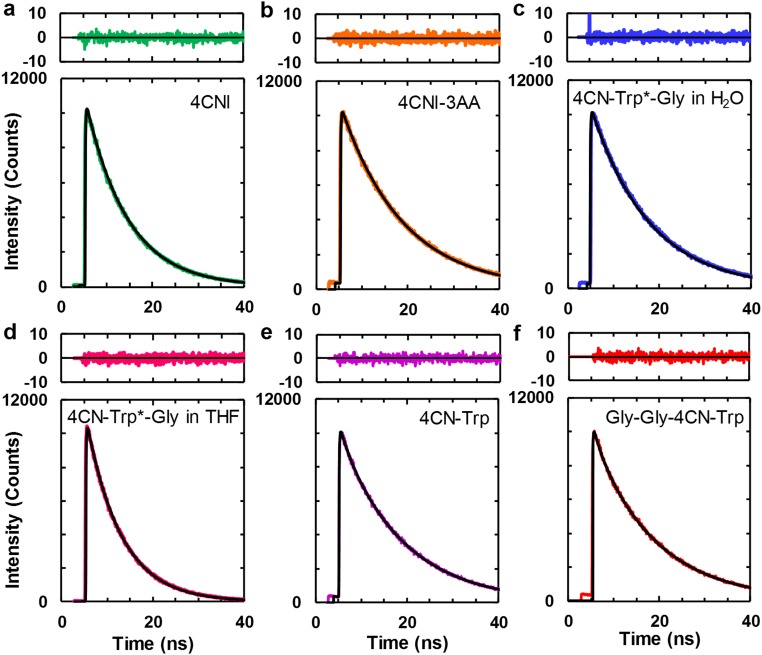
Fig. S2.
Fluorescence decay kinetics of (A) 4CNI, (B) 4CNI-3AA, (C) 4CN-Trp*-Gly, (D) 4CN-Trp*-Gly in THF, (E) 4CN-Trp, and (F) Gly-Gly-4CN-Trp, all in H2O except D. In each case, the smooth black line corresponds to the best fit of the respective data to a single-exponential (A–D) or a biexponential (E and F) function and the resultant lifetime(s) is given in Table 1. Top in each case is the corresponding residual plot.

