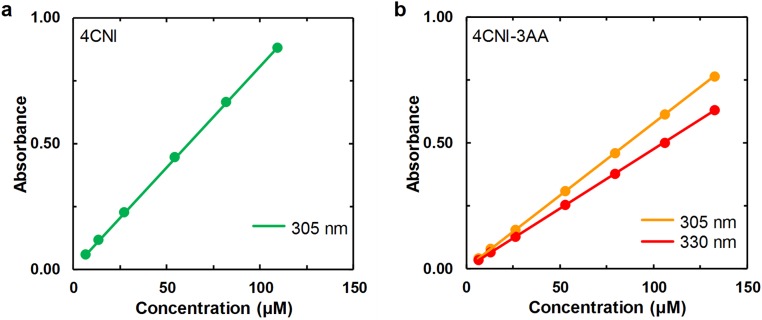
Fig. S4.
Beer’s law plots of (A) 4CNI and (B) 4CNI-3AA at the indicated wavelengths. The straight line in each case corresponds to a linear regression of the respective data with a zero y intercept, which yielded a molar extinction coefficient of 8,056 ± 24 M−1⋅cm−1 for 4CNI at 305 nm, and 5,778 ± 8 M−1⋅cm−1 and 4,750 ± 8 M−1⋅cm−1 for 4CNI-3AA at 305 nm and 330 nm, respectively.

