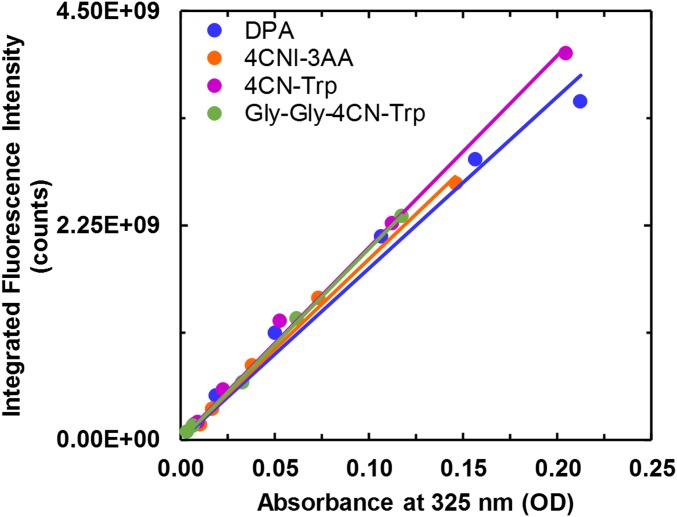
Fig. S5.
Integrated fluorescence intensity of DPA, 4CNI-3AA, 4CN-Trp, and Gly-Gly-4CN-Trp as a function of absorbance at 325 nm. The solid color line in each case corresponds to a linear regression of the respective data with a zero y intercept, which yielded a slope of (1.80 ± 0.07) ×1010 for DPA, (1.89 ± 0.04) ×1010 for 4CNI-3AA, (2.02 ± 0.04) ×1010 for 4CN-Trp, and (2.00 ± 0.03) ×1010 for Gly-Gly-4CN-Trp. The calculated QYs at 325 nm are shown in Table 1.

