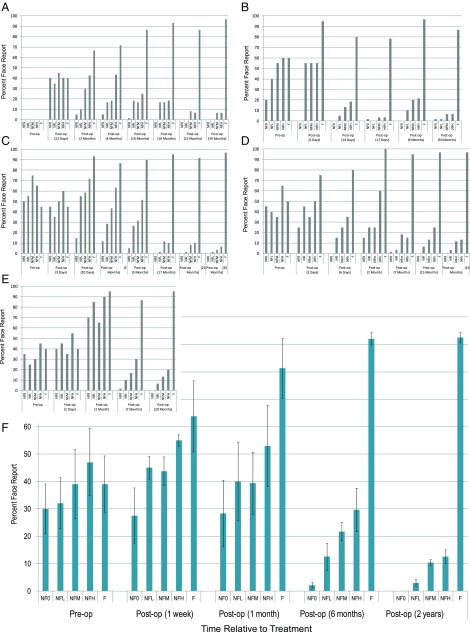
Fig. 2.
Timeline of emergence of face/nonface discrimination in newly sighted subjects. All values are in percentages of trials that were classified by subjects as a face. For NF0, NFL, NFM, and NFH, the bar represents false-alarm rate (proportion of nonfaces that are incorrectly classified as faces). For F, the bars represent the proportion of faces correctly classified (true positive/hit). The small plots with gray bars (A–E) show individual data, whereas F displays data averaged across all five subjects. op, operation.

