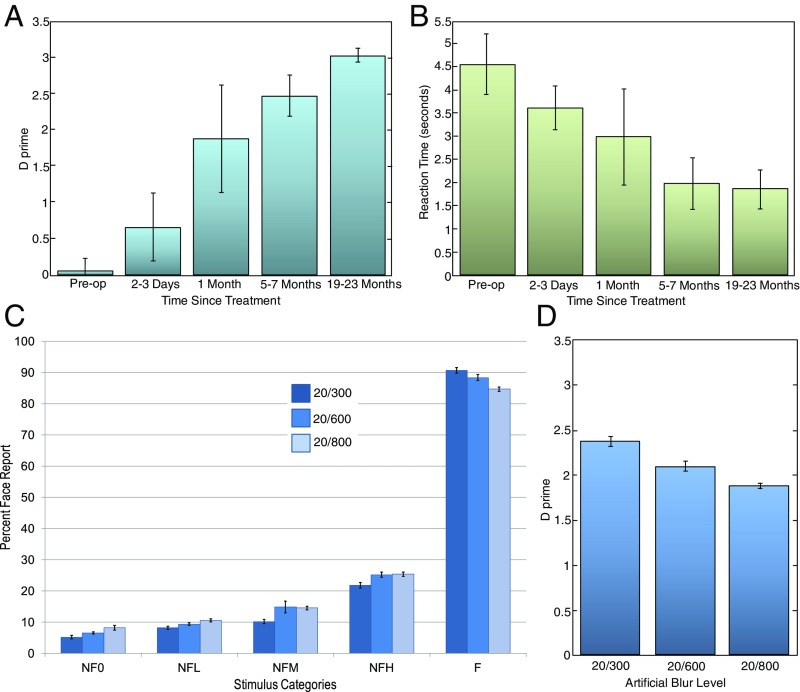
Fig. 3.
(A) Sensitivity (d′) values corresponding to the subjects’ performance at various points. (B) Averaged response-time data of the experimental group on the face/nonface discrimination task as a function of time relative to surgery. (C and D) Influence of artificially reduced acuity (using Bangerter blur-foils) on the face/nonface discrimination performance of age-matched normally sighted control participants. (C) Performance in terms of percentage face reports for each of the five stimulus conditions across three levels of blur that match or are worse than the postoperative acuities of the experimental group. (D) Discrimination sensitivity (d′) values as a function of induced blur level. op, operation.

