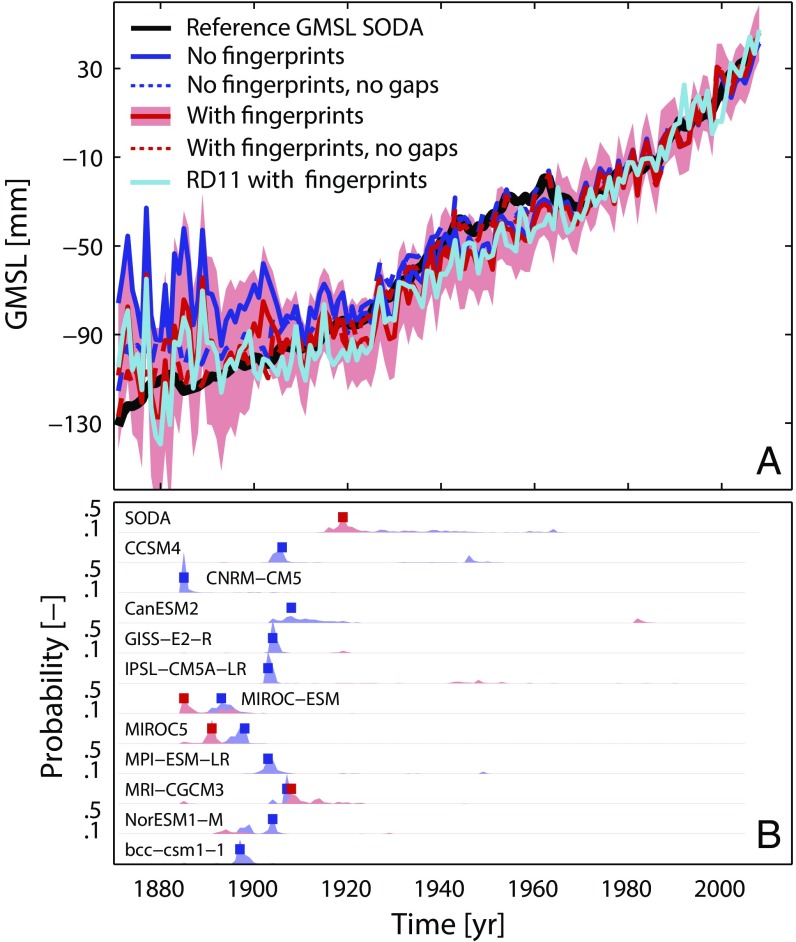
Fig. 2.
Performance of the area-weighted average approach in ocean models. (A) Sensitivity of the area-weighted average technique in the SODA reanalysis (its reference GMSL is shown by the black line) to the four initial data sets: Gaps as in reality, no fingerprint corrections applied (dark blue); assuming a full record, no fingerprint corrections applied (dark blue dotted); gaps as in reality, fingerprint corrections applied (red, with shading noting its 1σ uncertainty); and assuming a full record, fingerprint corrections applied (red dotted) (Fig. S3 for the respective curves from the 11 CMIP5-based synthetic sea level fields). The cyan curve represents a GMSL reconstruction with gaps as in reality and fingerprint corrections applied, but using the tide gauge subset from ref. 2. (B) Results of the Bayesian change point analysis (25) on the differences between each model specific reference GMSL and corresponding tide gauge reconstruction , without fingerprint corrections; red, with fingerprint correction) in each model. The change point analysis provides statistically the probability and timing of changes (shaded areas) in the relationship between the “true” model GMSL and its reconstruction. Tall, thin spikes suggest relative certainty in the timing of a change point, whereas wider spikes suggest more uncertainty in its timing. The red and blue squares mark the most probable timing from 500 iterations.

