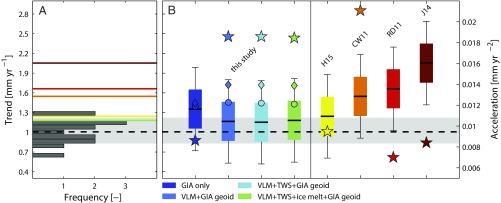
Fig. 3.
Linear trends in observed and modeled GMSL during the period 1902–1990. (A) Linear trend frequency in the CMIP5 GMSL ensemble from ref. 12 (dark gray bars), together with the median value (thick dotted line) and the 68% confidence bounds (light gray shading). The color coding follows B. (B) Linear trends of four different GMSL realizations based on different corrections applied in comparison with previous estimates with their respective uncertainties (based on ref. 25) as boxplots (1σ and 2σ uncertainties). The dots correspond to the trends when no area weighting is applied, whereas the diamonds provide trend estimates for the reconstructions based on rate stacking without area-weighting as in ref. 5. Also shown is the acceleration term (pentagrams, right y axis) for each reconstruction extracted from the first differences of the nonlinear trends during the entirely available period of each reconstruction since 1902.

