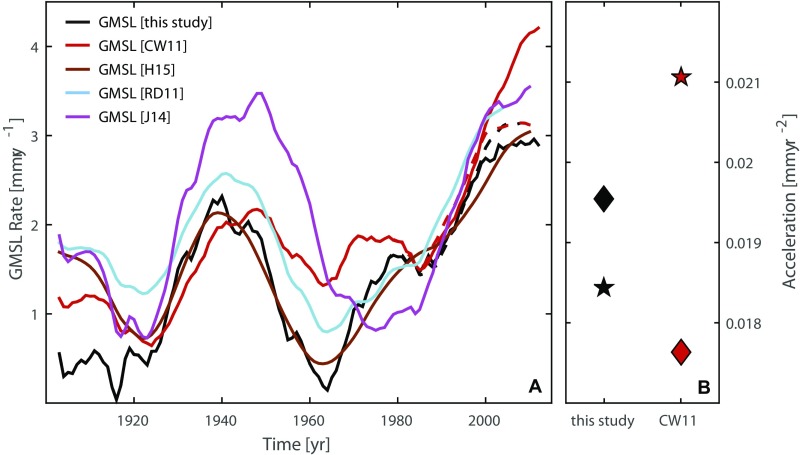
Fig. S3.
Comparison of GMSL rates from tide gauges and satellite altimetry. (A) Shown are the GMSL rates from ref. 1 (red) and our reconstruction (black), once based solely on tide gauges (solid lines), and once adjusted for GMSL from satellite altimetry (AVISO) since 1993 (dotted line). For comparison, the rates from ref. 2 (cyan), ref. 5 (magenta), and ref. 6 (brown) also are shown. (B) The corresponding acceleration coefficients (diamonds, adjusted; pentagrams, original). The figure demonstrates that the ref. 1 reconstruction overestimates GMSL since 1993 by up to 1 mm⋅y−1, leading to a very large acceleration over the entire century. However, once adjusted for the “true” GMSL from AVISO satellite altimetry since 1993, the adjusted reconstructions closely follow our original reconstruction, leading to an overall acceleration that is smaller than that estimated for our original GMSL reconstruction.

