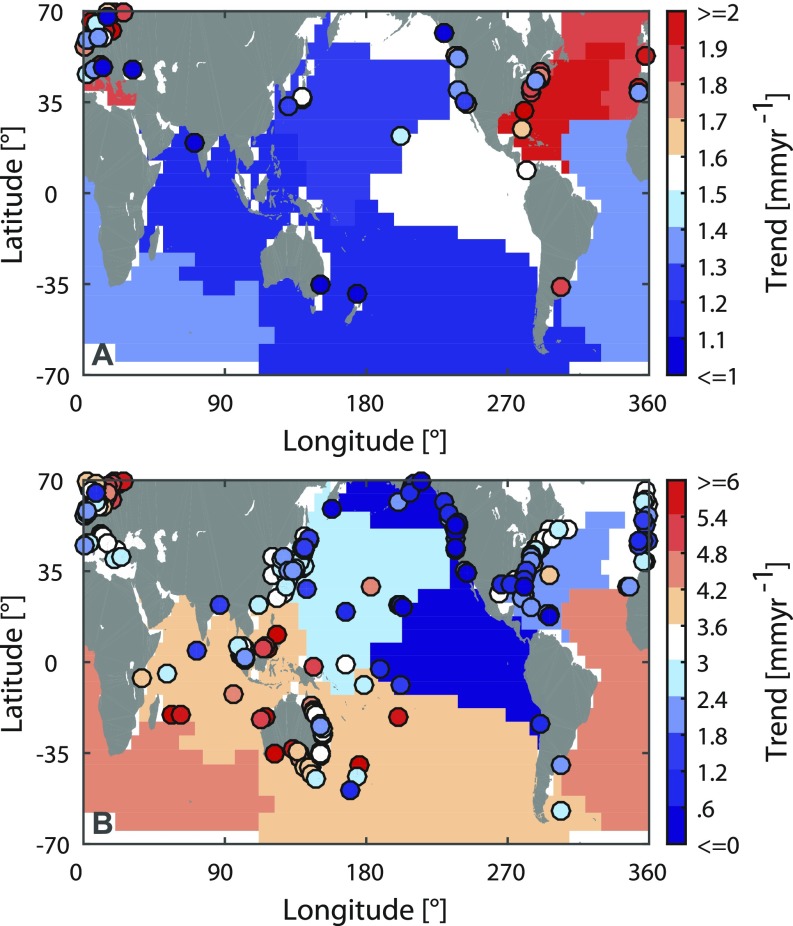
Fig. S8.
Trends in individual tide gauges corrected for VLM and geoid changes from TWS and ice melt. (A) Trends in tide gauges providing at least 70 y of data during the period 1902–2012. Blue colors denote trends equal or smaller than 1.5 mm⋅y−1, and white and red dots mark those stations providing long-term trends above 1.5 mm⋅y−1. The colored shaded areas represent the trends of the region-specific virtual stations. (B) Trends in tide gauge records providing at least 15 y of data during the period 1993–2012. Blue colors denote trends equal or smaller than 3 mm⋅y−1, whereas white and red dots mark those stations providing long-term trends above 3 mm⋅y−1.

