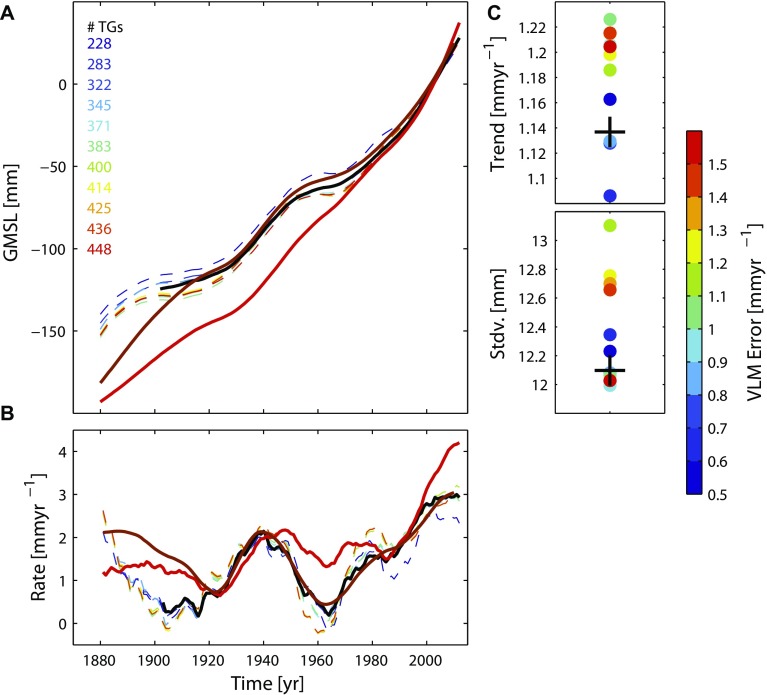
Fig. S9.
Effect of tide gauge selection on GMSL and extension to 1880. (A) Shown are 11 realizations of our GMSL curve, using different subsets of tide gauges resulting from VLM error thresholds between 0.5 and 1.5 mm⋅y−1, extending back to 1880 (dashed lines). Since before 1902, there is no information on the geoid corrections; these curves are corrected only for VLM. The GMSL curve from Fig. 3A, including all corrections, is shown for comparison in black. Also shown are the reconstructions from refs. 1 and 6 (solid red and brown lines, respectively). (B) Corresponding rates. (C) Linear trends (1902–1990) and SDs (1902–2012) from each reconstruction (colored dots) shown in A and the final curve from Fig. 3A (black cross).

