Fig. 1.
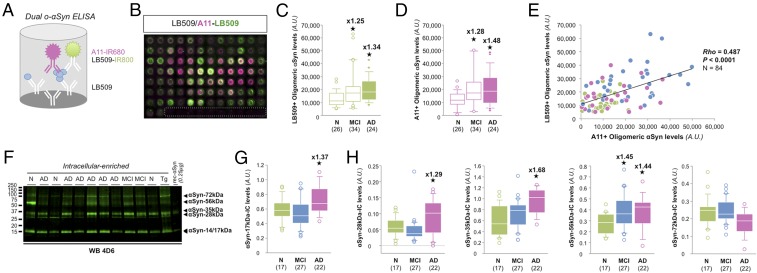
Identification of soluble αSyn assemblies in human brain tissues. (A) Experimental design of oligomeric αSyn ELISA. The capture antibody consisted in the human specific αSyn antibody LB509 and a tandem of detecting antibodies (LB509-IR800 and A11-Biotin) was used to reveal oligomeric αSyn. (B) Representative infrared images of oligomeric αSyn measurements in Religious Orders Study specimens (n = 84) using either LB509-LB509 (homotypic) or LB509-A11 sandwiches on 96-well ELISA plates. Each well represents a separate patient sample. The dashed rectangle indicates increasing amounts of freshly resuspended recombinant monomeric αSyn (last row, samples 86–96, 1 pg to 10 ng). Please note that no signal was detected confirming the specificity of the assay. (C and D) Box plots for oligomeric αSyn species using either the homotypic LB509 sandwich (C) or the LB509-A11 sandwich (D). Obvious differences were observed between the AD group (n = 24) and the NCI (N) group (n = 26). (Mann–Whitney U test, F1, 47 = 4.9728 and F1, 47 = 5.0115, respectively; Student t test, ★P < 0.05 vs. NCI.) (E) Regression analyses indicated a positive correlation between oligomeric αSyn species detected with either LB509/LB509 (x axis) or with LB509/A11 (y axis) (n = 84; Spearman rank correlation, P < 0.0001). (F) Western blot (WB) analyses of soluble αSyn species in IC-enriched fractions using 4D6. Tg mice from the TgI2.2 line and recombinant human αSynWT were used as positive controls. (G and H) Box plots for monomeric (G) and putative oligomeric (H) αSyn species in the temporal cortex of subjects with NCI, MCI, or AD devoid of αSyn inclusions. Numbers in parentheses indicate group sizes. NCI is shown in green, MCI in blue, and AD in magenta boxes. In box plots of all figures, the bar inside the box indicates the median; the upper and lower limits of boxes represent the 75th and 25th percentiles, respectively. Bars flanking the box represent the 95th and fifth percentiles. (Kruskal–Wallis followed by Mann–Whitney U test, F1, 66 = 4.2289, F1, 66 = 4.4464, F1, 66 = 4.7717, F1, 66 = 3.8853, and F1, 66 = 2.4774 respectively; ★P < 0.05 vs. NCI.) A.U., arbitrary units.

