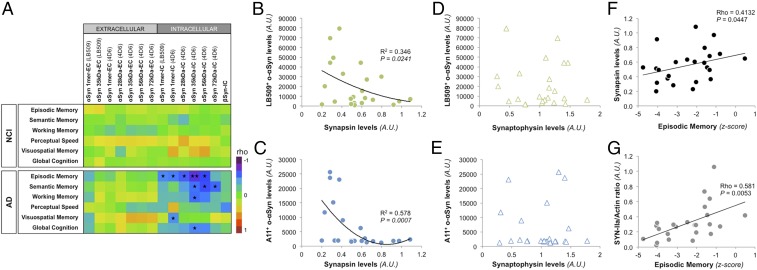
Fig. 2.
Soluble αSyn assemblies are associated with changes in cognitive function and synaptic expression in AD. (A) Following the measurements of soluble αSyn species in EC- and IC-enriched fractions of human temporal cortices, multivariate analysis was performed within the NCI and AD groups. Monomeric αSyn expression was used as positive control (18) and βSyn expression was used as negative control. Finally, all measures of proteins were performed using the same technique (SDS/PAGE followed by Western blot) to avoid inherent differences between techniques. Raw measurements of all proteins were used for the analysis. (Spearman’s ρ correlation with Bonferroni correction, ★P < 0.05; ★★P < 0.01, nNCI = 26 and nAD = 24). (B and C) Regression analyses between total synapsin protein expression and o-αSyn measured by ELISA using either LB509 (B) or A11 (C) as the detecting antibody in all AD cases tested (n = 24). Best-fitting models indicated significant negative correlations for both o-αSyn measurements (Spearman’s ρ, ρ = −0.346, P = 0.0241 and ρ = −0.551, P = 0.0052 respectively, n = 24). (D and E) Regression analyses between SYP protein expression and o-αSyn measured by ELISA using either LB509 (D) or A11 (E) as the detecting antibody revealed no correlations between o-αSyn and SYP (Spearman’s ρ, ρ = −0.1745, P = 0.4248 and ρ = −0.1470, P = 0.4932 respectively, n = 24). (F and G) Regression analyses revealed positive correlations between synapsin levels, total (F) or isoform specific (G), and episodic memory performance in our AD cohort (Spearman’s ρ, ρ = 0.4132, P = 0.0447 and ρ = 0.581, P = 0.0053 respectively, n = 24). A.U., arbitrary units.

