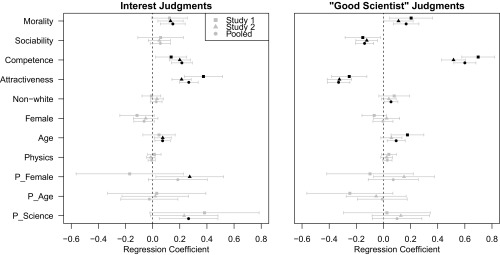
Fig. 1.
Regression coefficients for studies 1 and 2, and pooled across studies. All predictors were standardized. Error bars show 95% confidence intervals; coefficients with CIs that exclude zero are highlighted in black. P_Age, participant age; P_Female, participant gender; and P_Sci, participant science engagement.

