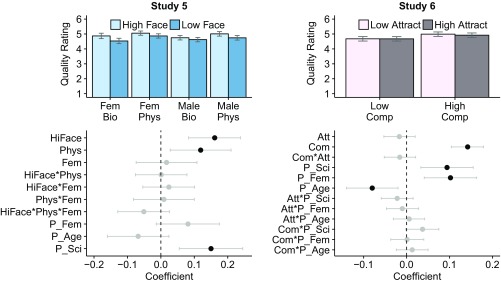
Fig. 3.
(Top) The mean quality ratings from (Left) study 5 and (Right) study 6. (Bottom) The corresponding regression coefficients. All predictors were standardized (prior to computing interaction terms). Error bars show 95% Wald confidence intervals; coefficients with CIs that exclude zero are highlighted in black. HiFace, researcher looks like a good scientist.

