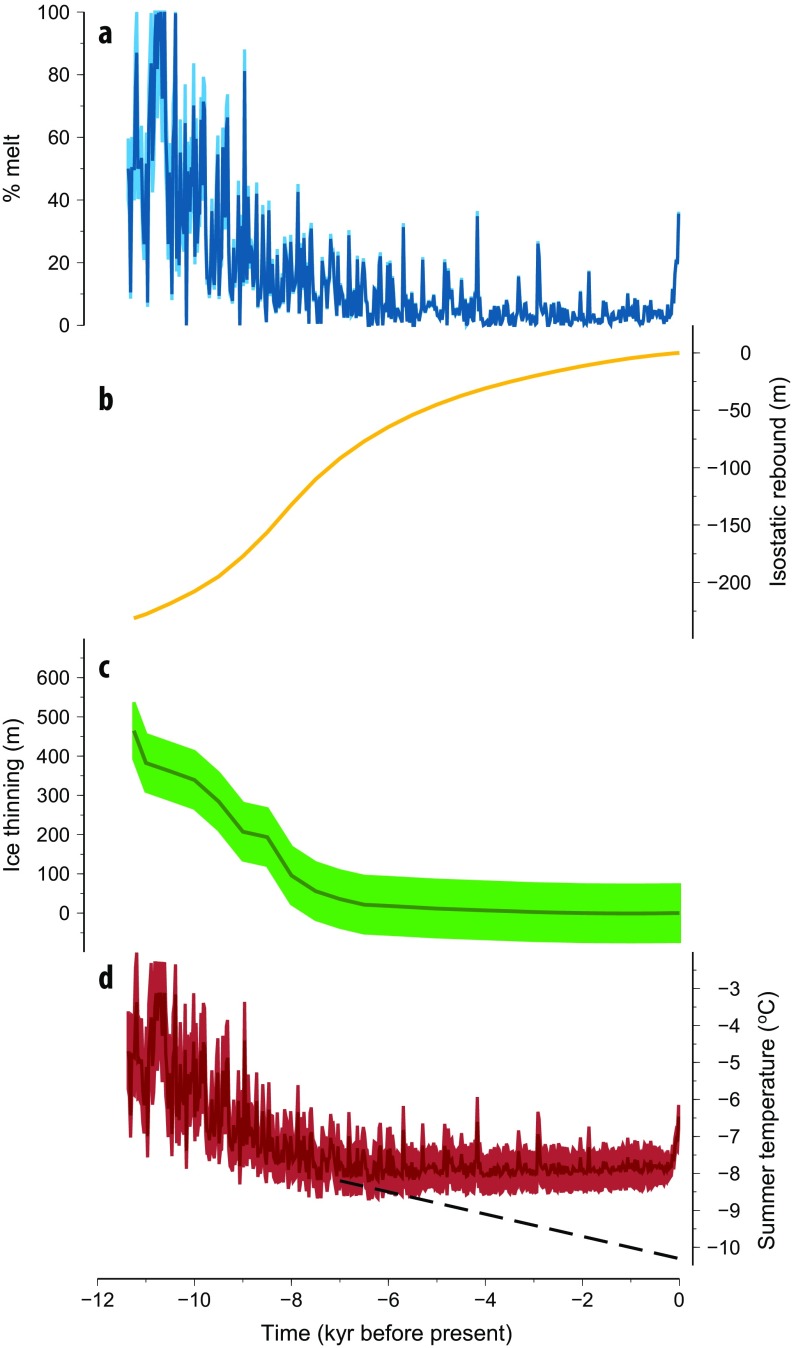
Fig. S2.
Agassiz melt-record temperature reconstruction: (A) Agassiz melt record and estimated corrections for (B) isostatic adjustment and (C) thinning of the Innuitian ice sheet at the borehole site. (D) The resulting summer (JJA) temperature reconstruction (dark red) with its 2σ uncertainty (light red). The potential mid to late Holocene trend for temperatures below −8 °C (when there is absence of melt) is indicated by the dashed black line.

