Fig. 2.
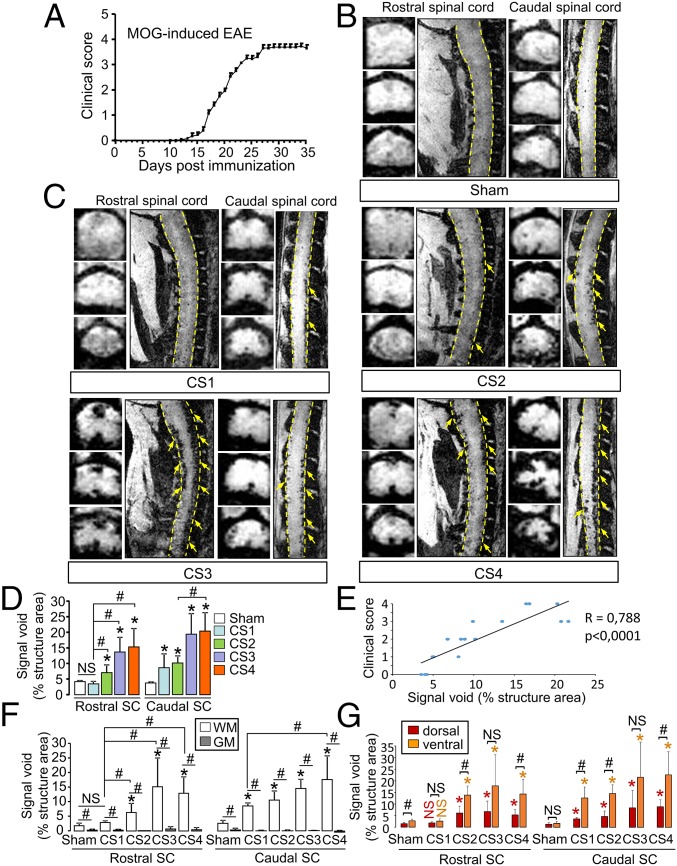
Spatiotemporal distribution of MPIOs-αP-selectin–induced hyposignal follows the clinical worsening in chronic EAE mice (MOG-induced EAE). (A) Clinical score (CS) evolution in MOG-induced EAE. (B and C) Representative axial and sagittal T2*-weighted images of rostral and caudal spinal cord (dashed line) after MPIOs-αP-selectin injection did not reveal induced signal void in sham (B) or EAE (C) mice. Yellow arrows, signal void. (D) Corresponding quantification. NS, not significant; *P < 0.05 vs. the same structure in sham animals; #P < 0.05. (E) Correlation between signal void and clinical score. (F and G) Quantification of the signal void distribution between white matter (WM; white bar) and gray matter (GM; gray bar) (F) and between dorsal (red bar) and ventral (orange bar) spinal cord (G) (quantified from coronal images). NS, not significant; *P < 0.05 vs. sham in the same structure; #P < 0.05 vs. indicated condition. See Table S1 for detailed sample size.

