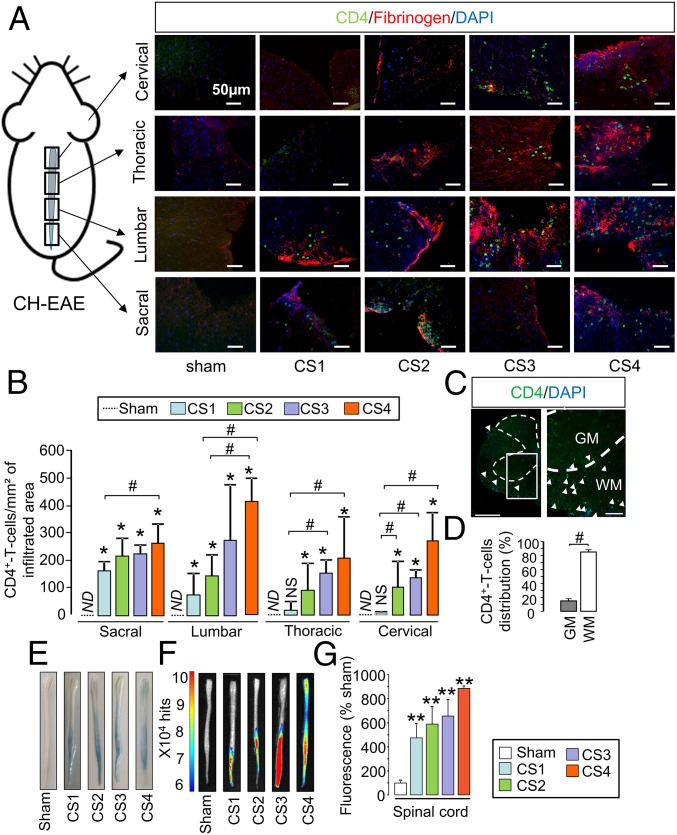
Fig. 3.
Spatiotemporal dissemination of the immune cell infiltration and BSCB opening follow the pattern of P-selectin vascular activation in the spinal cord of MOG-induced EAE mice. (A) Immunohistological images of the infiltrated areas of the MOG-induced EAE spinal cord. CD4+ leukocyte (green), fibrinogen (red), and cell nuclei (blue) show the spatiotemporal dissemination of immune cell infiltration. Each line of images corresponds to a spinal cord section (in order from top to bottom: cervical, thoracic, lumbar, and sacral). Each column corresponds to a clinical score (CS; CS1 to CS4). (Scale bars: 50 µm.) (B) Corresponding quantification. ND, nondetected; *P < 0.05 vs. the same structure in sham animals; #P < 0.05 vs. indicated condition. n = 3 mice for each clinical group. (C) Immunohistological image of whole section of MOG-induced EAE spinal cord (peak of the disease) with a low (Left) and a high (Right) magnification. [Scale bars: 500 µm (Left) and 100 µm (Right).] GM, gray matter; WM, white matter. (D) Whole spinal cord quantification of the distribution of the CD4+ T-cell infiltration between white matter (white bar) and gray matter (gray bar). #P < 0.05. (E) Spinal cord photographs after i.v. Evans blue dye injection in MOG-induced EAE. (F) Ex vivo optical imaging of Evans blue fluorescence. (G) Quantification of fluorescence in spinal cord tissues. **P < 0.01 vs. the same structure in sham animals. See Table S1 for detailed sample size.

