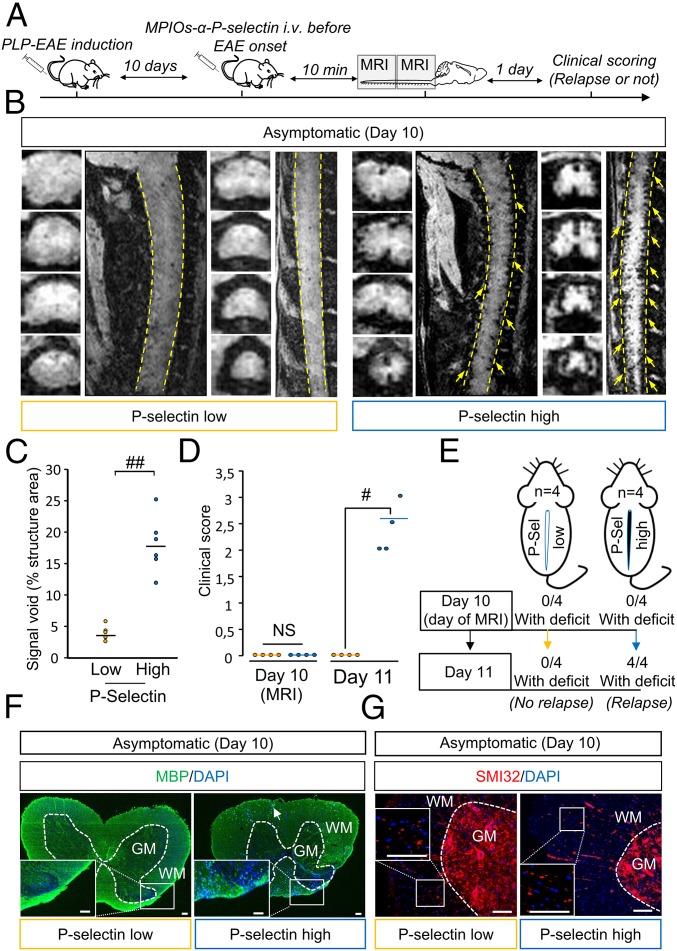
Fig. 6.
MPIOs-αP-selectin–induced hyposignal predicts relapses in PLP-induced EAE. (A) Experimental design. (B) Representative high-resolution T2*-weighted images after MPIOs-α P-selectin injection PLP-induced EAE mice without deficits (CS 0 at day 10; D10). Yellow arrows indicate signal voids. (C) Corresponding signal void quantification. ##P < 0.01. (D) Clinical score of P-selectin-high (blue line) or -low (yellow line) mice the day of MRI acquisition (D10) and the day after (D11). #P < 0.05. (E) Schematic representation of the main findings. (F) Representative immunohistological images of myelin basic protein (MBP; green) and cell nuclei (blue) in asymptomatic P-selectin-low and -high animals. (G) Representative immunohistological images of axonal damage (SMI-32; red) and cell nuclei (blue) in asymptomatic P-selectin-low and asymptomatic P-selectin-high animals. (Scale bars: 100 µm.) See Table S1 for detailed sample size.

