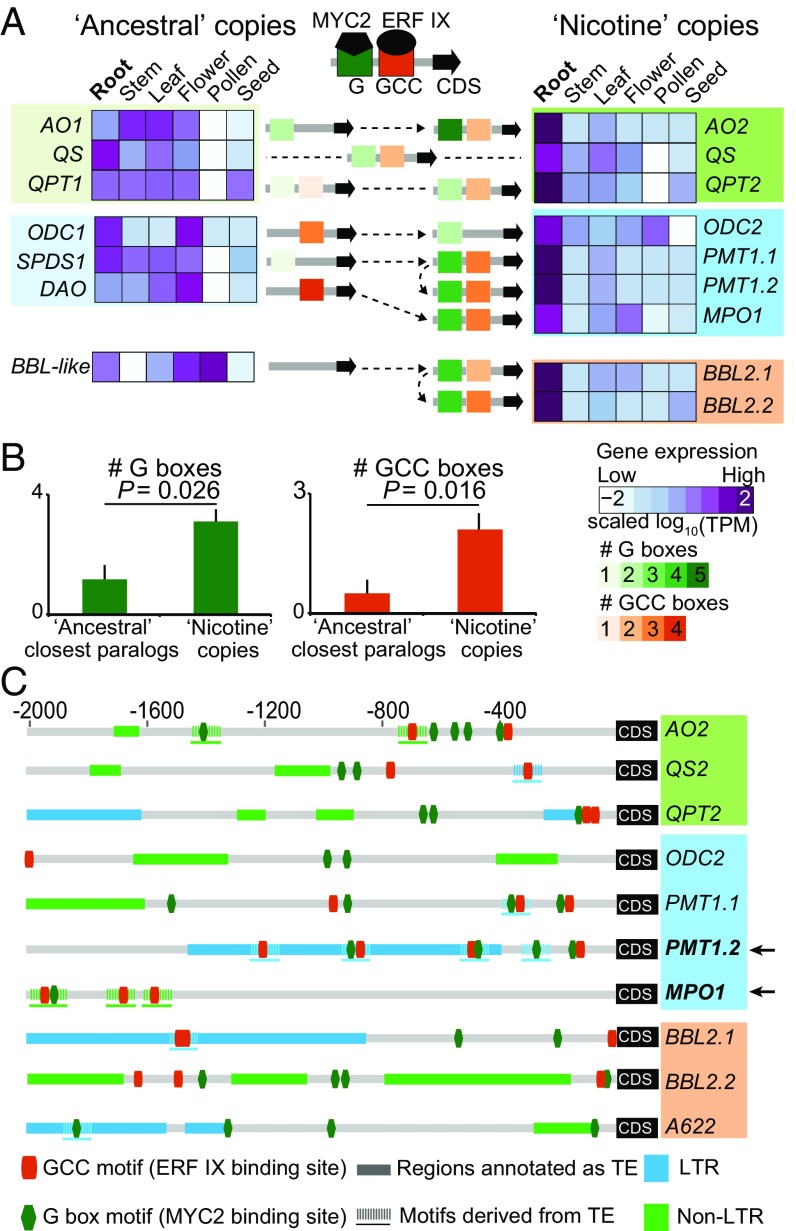
Fig. 4.
Coordinated transcriptional regulation of nicotine biosynthetic genes in roots was likely facilitated by transposon-derived transcription factor binding site insertions. (A) Acquisition of transcription factor binding motifs and root-specific expression evolution of nicotine biosynthesis genes (5, 23). Heatmaps depict the scaled expression of nicotine biosynthetic genes and their ancestral copies or closest paralogs across six distinct tissues. Light to dark violet coloration denotes low to high tissue-level expression (TPM, transcripts per million). A622, which likely neofunctionalized without being duplicated in solanaceous species, was not included in this analysis. Gene color categorizations are as used in Fig. 3: light colors correspond to NAD and polyamine primary metabolic pathways and brighter colors to subbranches of the nicotine pathway. The root-specific expression of nicotine biosynthetic genes and dramatic transcriptional up-regulation during insect herbivory is coordinated by the action of MYC2 and ERF IX transcription factors, which respectively target G- and GCC-type boxes in the promoters. Numbers of GCC and G-box motifs detected within 2-kb upstream region of nicotine biosynthetic genes and their ancestral copies are represented using specific color gradients (from light to dark green for increasing number of G boxes and light to dark orange for GCC boxes). (B) Average numbers of G and GCC boxes for the “ancestral” closest paralogs and “nicotine” copies of gene sets. P-values were calculated based on Wilcoxon rank sum test. (C) Many GCC and G-box motifs from nicotine biosynthesis genes are likely derived from TE insertions. Each row depicts the motif and TE annotation of the 2-kb upstream region of an individual nicotine biosynthesis gene. The predicted GCC and G-box motifs are shown in dark orange and dark green small boxes, respectively. The regions that were annotated as TEs from RepeatMasker are shown as rectangles with two different colors. Light blue, LTR; green, non-LTR. Motif sequences and their 150-bp flanking region showed significant homology (E-value less than 1e-5) to annotated TE sequences in N. attenuata are shown in dashed lines. In the case of PMT1.2 and MPO1 (highlighted by black arrows), almost all G and GCC boxes are apparently derived from TE insertions.

