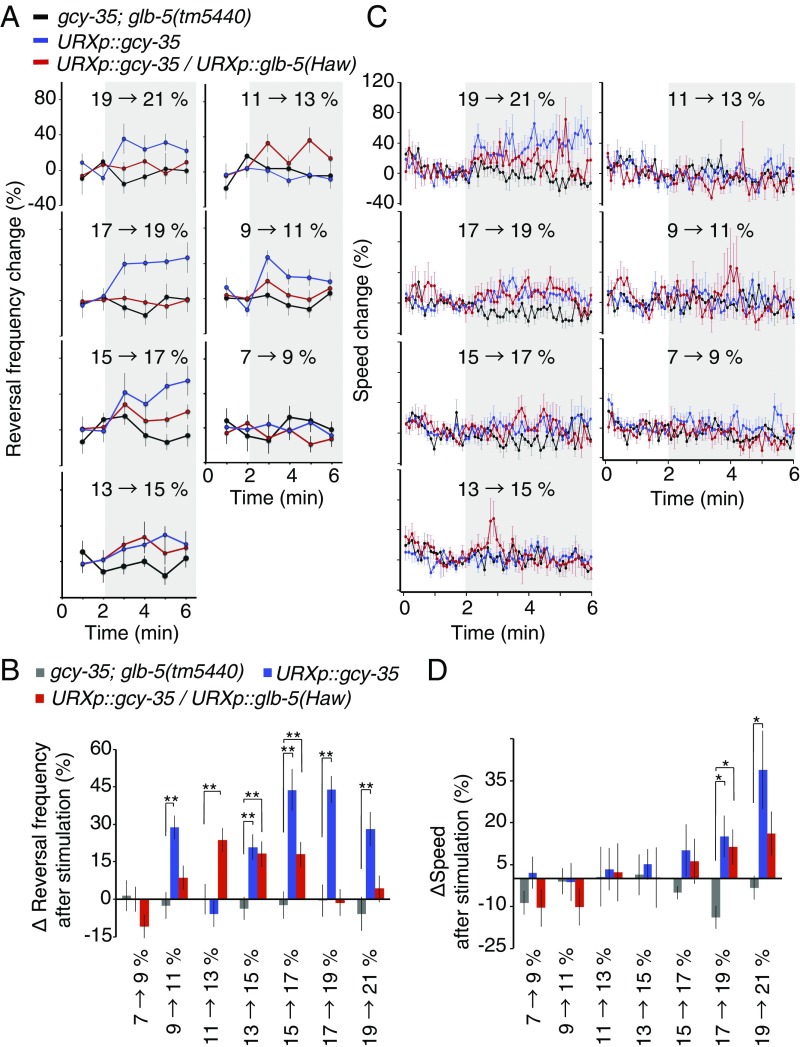
Fig. 4.
The relationship between O2 stimulus intensity and URX-dependent behavioral outputs. (A) Frequency of reversal behavior evoked by O2 step stimuli in animals of the genotypes indicated. Reversal frequencies were quantified every minute. n = 15–30 animals. Bars represent SEM. (B) Reversal frequency evoked by step O2 stimuli averaged over 4 min after the stimulus. Data represent mean ± SEM. (C and D) Instantaneous speed in response to step O2 stimuli. n = 30–60 animals. Plots show mean ± SEM. (D) Mean speed ± SEM calculated for a 4-min interval beginning 30 s after the step stimulus. The behavior of gcy-35(ok769); glb-5(tm5440) animals was used as a negative control and is shown as black traces or gray bars. *P < 0.05, **P < 0.01, ANOVA with Dunnett’s post hoc test.

