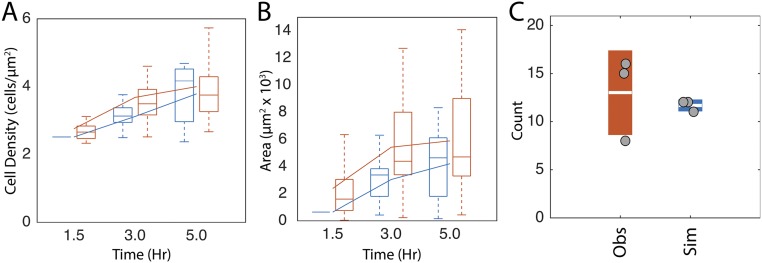
Fig. S5.
Quantification of closed-loop simulations without agent alignment. (A and B) Distribution of average cell density inside aggregates (A) and aggregate area (B) in closed-loop simulations without any turning angle dependencies (blue lines). Experimental data are in blue. Box plots are formatted as described in Fig. 4. (C) Circles indicate number of aggregates in each experimental movie (Obs) or simulation (Sim). Boxes indicate sample SD with the white line indicating the sample mean.

