Fig. S7.
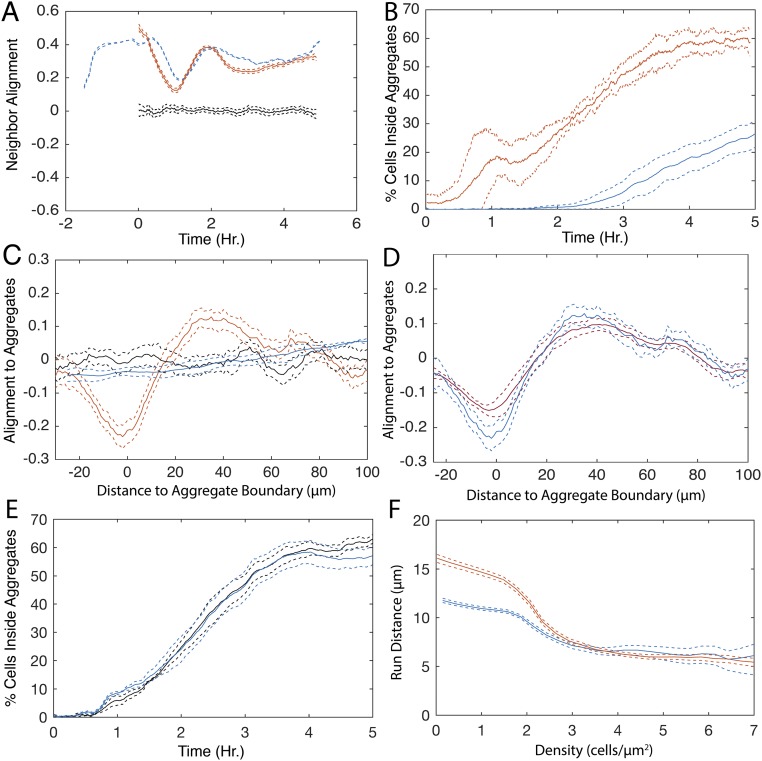
Closed-loop simulation controls. (A) Time course of mean (solid lines) and 95% bootstrap confidence intervals (dashed lines) of nematic agent alignment with neighboring runs in a 20-min sliding window for simulations (blue) and experimental (red). Negative values indicate the simulation prerun to provide agents time to align. Black lines indicate analysis performed with randomly chosen runs instead of neighboring runs. (B) Average (solid lines) and SD (dashed lines) of the percentage of cells inside aggregates for experimental (red lines) and simulation (blue) with a prerun but no turning angle dependencies. (C) Average (solid lines) and 95% confidence intervals (dashed lines) of mean run vector alignment with vector pointing to the nearest aggregate centroid in open-loop simulations without any turning angle dependencies (blue lines). Black lines indicate a random distribution as in Fig. 5D, and red lines indicate observed experimental alignment. (D) Average (solid lines) and 95% confidence intervals (dashed lines) of orientation of runs relative to the nearest aggregate centroid. Experimental data are in red, and closed-loop simulations in which distance and orientation to nearest aggregate centroid were included as a dependence for choosing turning angle are in blue. The value −1 indicates all runs are tangent to aggregate centroid, and 1 indicates all runs are radial to aggregate centroid. (E) Average (solid lines) and SDs (dashed lines) of fraction of cells inside aggregates in simulations with (blue) and without (black) time as a dependence for choosing the agent’s next turning angle. (F) Average run distance in a 2-cell/μm2 sliding window for all runs (persistent and nonpersistent) that occurred during 1.5–2 h (blue lines) and 2.5–3.4 h (red lines). Dashed lines indicate 95% mean confidence intervals.

