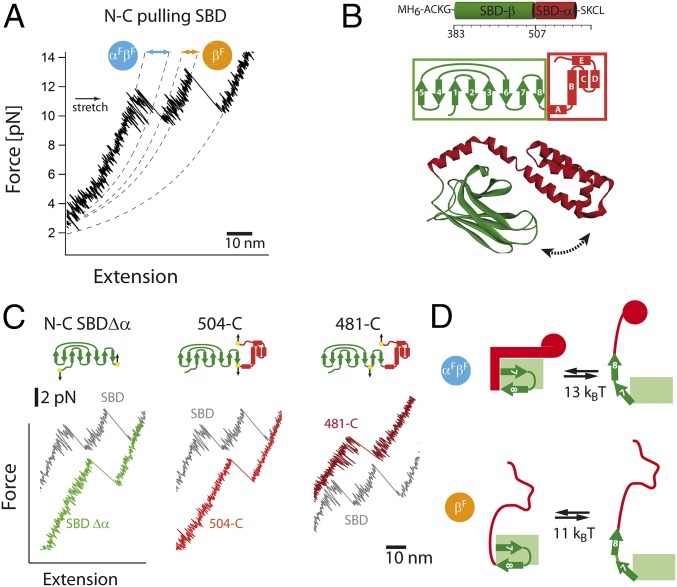
Fig. 2.
High-resolution single-molecule force experiments reveal fluctuations between subdomains. (A) A magnification of the SBD force-extension trace at 10 kHz. Before unfolding of the α- and β-subdomain, significant fluctuations are observed (αFβF). After unfolding of α-subdomain, much shorter fluctuations are observed (βF). The dashed lines correspond to worm-like chain (WLC) fits. (B) Structure and secondary structure topology of the SBD. (C) A magnification of the force-extension trace at 10 kHz for the SBD along different pulling directions. (D) Structural interpretation (helical part in red, β-subdomain in green) of upper and lower states and associated free energies with αFβF and βF fluctuations. For details, see Results.

