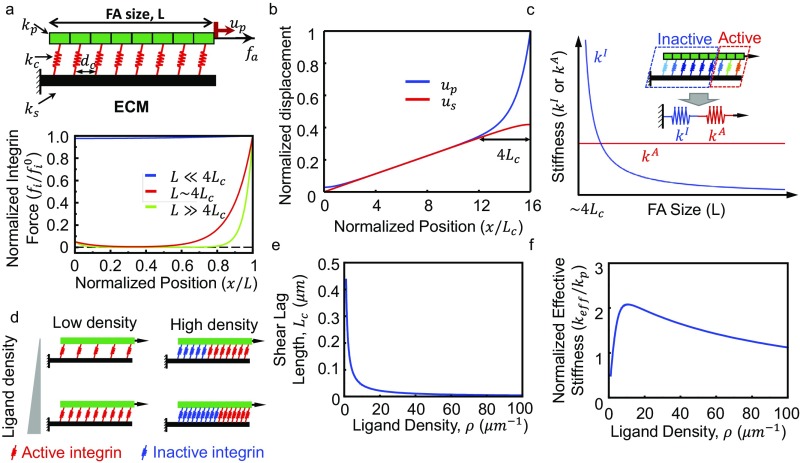
Fig. S5.
(A) Schematics of the 1D FA–ECM model. The integrin force distribution is very sensitive to FA size. For small FAs, integrin force is distributed almost uniformly; regions where integrins are force-free appear when FA size is comparable to 4Lc. The leading edge carries the majority of integrin force, and the size of this highly loaded region is a constant if FA size is much larger than 4Lc. A large FA (≫4Lc) can be divided into two parts based on the magnitude of the integrin force; the effective stiffnesses of the two parts are shown in C. Notice that the horizontal axis in C starts from L ∼ 4Lc. A and C are reprinted with permission from ref. 24, with permission from Elsevier (www.sciencedirect.com/science/journal/00063495). (B) Normalized displacement field (with respect to the maximum displacement) for FA plaque (up) and ECM (us) for an FA of size 16Lc. Note the size of the region of displacement mismatch between the FA plaque and the ECM is ∼4Lc. (D) At low ligand densities, more active integrins are introduced as ligand density increases because the characteristic length is large (E); at high ligand density, a part of the integrins become inactive and the inactive region becomes larger as ligand density increases because the characteristic length decreases (E). (F) Normalized effective stiffness as a function of ligand density for FAs of 0.1 µm, indicating ligand density has similar biphasic influence on stiffness sensing as FA size.

